DGRA LN
WisdomTree US Quality Dividend Growth UCITS ETF - USD Acc

Published 25 July 2024

Head of Research, WisdomTree Europe.
After a strong start to the year, markets entered the second quarter, weighted by increasing inflation worries. With expectations of the number of Federal Reserve cuts melting in the sun, the MSCI World posted a negative 3.7% return in April. However, the inflation print improved over the rest of the quarter, leading to a more hopeful tone in May and June. While cuts remain elusive, the new expected date for cuts to begin is now September; as such markets have restarted their march upward. Artificial Intelligence and Semiconductor-related stocks continued to lead, though a broadening of the market remains elusive.
This instalment of the WisdomTree quarterly equity factor review aims to shed some light on how equity factors behaved during the second quarter and how this may have impacted investors’ portfolios.
In Q2, the MSCI World (+2.6%) and the MSCI USA (+3.9%) continued to perform quite well. After a slight inflation scare at the end of Q1 and the start of Q2, markets veered back to known territory, with large Tech Megacaps and Semiconductors leading the way. The US continues to lead despite the continuous postponement of rate cuts, thanks to a robust economy and inflation firmly on a downward path. Emerging Markets ended up performing the strongest during the quarter with the MSCI EM gaining 5%.
Factor performance also highlights this form of consistency from the markets:
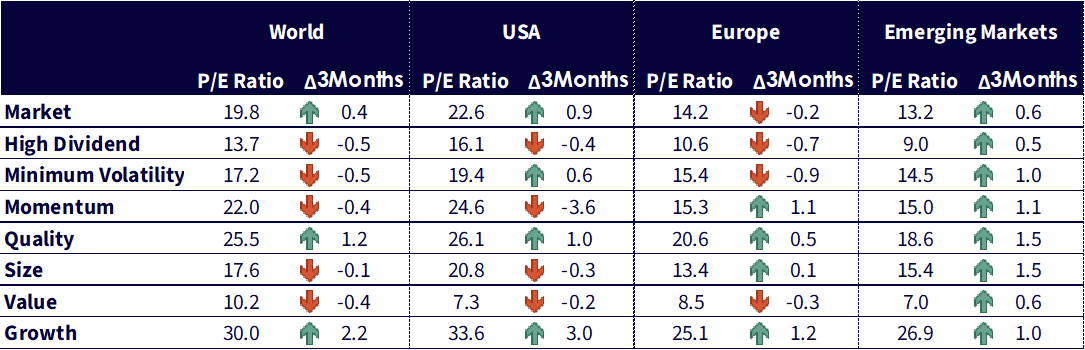
Source: WisdomTree, Bloomberg. 31 March 2024 to 30 June 2024. Calculated in US Dollars for all regions except Europe, where calculations are in EUR. Historical performance is not an indication of future performance and any investments may go down in Value.
Year to date, the MSCI World is up 11.7% and the leading factors are Momentum, Quality and Growth. All other factors are underperforming. In the first six months of the year, it is clear that the success of a given factor is intimately linked to its investment in the ‘Magnificent Seven’. All three factors that have outperformed are overweighted ‘Magnificent Seven’. Growth is the most overweighted, but Momentum also exhibited 5.7% more of the ‘Magnificent Seven’ than the benchmark, and Quality was overweighted 2.4%. The remaining factors, that underperformed, were all underweighted, from High Dividend with an underweight of -13% to Value or Small Cap that do not invest at all in the ‘Magnificent Seven’.
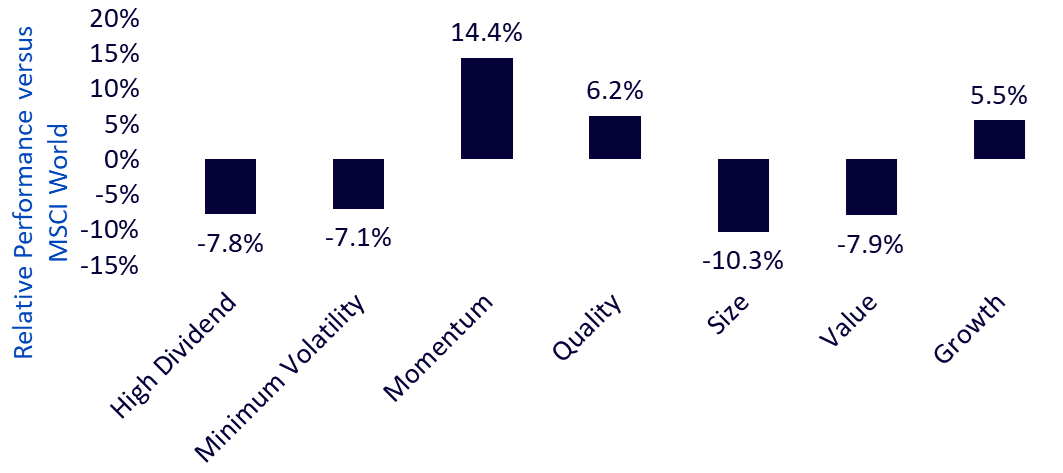
Source: WisdomTree, Bloomberg. 31 December 2023 to 30 June 2024. Calculated in US Dollars for all regions except Europe, where calculations are in EUR. Historical performance is not an indication of future performance and any investments may go down in Value.
This dominance of large caps and large cap tech is particularly evident when comparing the relative performance of the S&P 500 and the S&P 500 Equal Weighted. After a short period of dominance in 2022, the S&P 500 Equal Weighted has been crushed by its market cap equivalent. In 2024, we observed a slight pause at the beginning of Q2, but in May and June, the S&P 500 accelerated even further, outperforming the S&P 500 Equal Weighted by 2.1% over the two-month period.
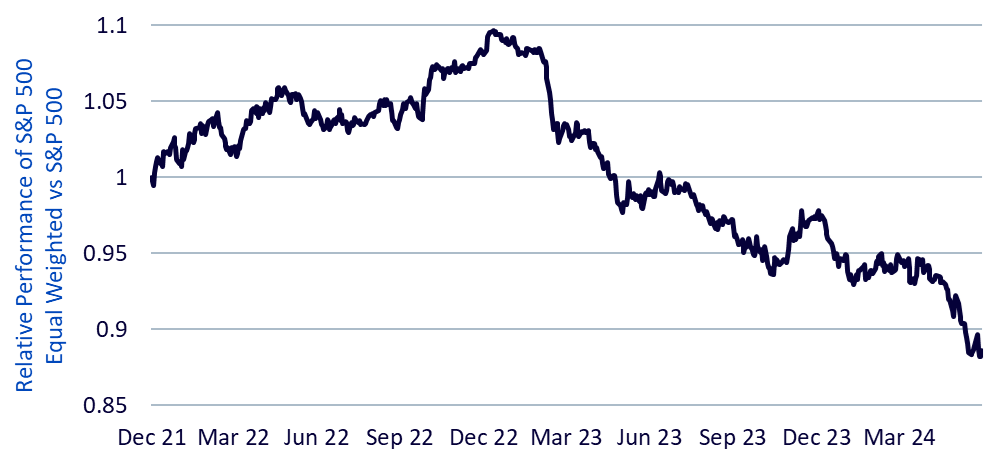
Source: WisdomTree, Bloomberg. 31 December 2021 to 30 June 2024. Calculated in US Dollars for all regions except Europe, where calculations are in EUR. Historical performance is not an indication of future performance and any investments may go down in Value.
In Q2 2024, developed markets became slightly more expensive. But again, the impact of large cap tech was overwhelming. Those stocks became more expensive leading factors like Growth and Quality to also become more expensive. On the contrary, the valuation of the rest of the market declined, leading to very attractive levels for a large portion of US equities. Europe’s valuations moved down on average. Emerging Markets, however, became more expensive across the board with Small Caps and Quality stocks leading the way.
Source: WisdomTree, Bloomberg. As of 30 June 2024. Historical performance is not an indication of future performance and any investments may go down in Value.
As we look forward to the second half of the year, we note three potential catalysts for the long-awaited broadening of the market and, with it, some form of small-cap and value revival. First, the Federal Reserve is finally moving toward its first cut, which is widely anticipated to happen in September. Such a cut would benefit less profitable companies that form a large part of the small cap universe and would boost further this market segment. Second, the gap in earnings growth expectation between the ‘Magnificent Seven’ and the rest of the market is closing toward the end of the year. This should create opportunities for stocks outside those seven mega caps to captivate investors’ attention. Finally, the US presidential election creates significant uncertainty that weighs on the market. Historically, it shows that once the election’s results are known, whichever the results, uncertainty lifts, and this very often creates a late-year rally as well as a small-cap rally. A balanced approach allowing for investment outside of large-cap mega caps could allow investors to benefit from such a broadening.

Head of Research, WisdomTree Europe.
Pierre Debru leads WisdomTree’s European research team and plays a pivotal role in the strategic direction of our European research efforts. His key areas of expertise extend across equity factors and quantitative strategies, portfolio construction and model portfolios, and thematic and crypto investments. Before joining the company in 2019, Pierre worked in Investment Research for DWS and the Xtrackers range for over five years. During this period, he focused on smart beta investments, model portfolio construction and thought leadership. Pierre has over 20 years of experience in investments and structured asset management. He graduated from Ecole Central Paris and obtained a Master of Science in Mathematics applied to Finance.


