CRRY LN
WisdomTree Enhanced Commodity Carry

Published 30 April 2025

Associate Director, Quantitative Research at WisdomTree in Europe
One of the most important characteristics of futures markets is the shape of the futures curve—that is, the structure of prices for delivery at different dates. This curve shape contains a lot of information.
The information embedded in the shape of the futures curve can be used in two key ways. It can inform how investors select commodities— that is, choosing which commodities to overweight and underweight based on the shape of their futures curves. This is the aspect most commonly addressed in academic research, which has extensively focused on identifying and quantifying roll yield opportunities through cross-sectional commodity selection.
What has been somewhat neglected in academic literature is the importance of contract selection within a single commodity. That is, choosing which point on the curve to invest in. Practitioners have recently started to close this gap by introducing strategies that favour deferred contracts, where the cost of carry is often lower.
For a commodity future, the cost of carry represents the gain or loss incurred from holding a futures contract until its maturity, which is unrelated to any gain or loss associated with the physical commodity itself. Typically, when the futures price exceeds the spot price, the expected cost of carry becomes negative from the investor's perspective. This implies that, if the curve's shape remains unchanged, maintaining a futures position will result in losses over time.
The cost of carry usually reflects the total cost associated with holding a futures position until maturity, including storage, insurance, and financing costs, offset by any convenience yield1 (which is the cost of carry for that physical commodity). For a futures investor, a high cost of carry means that simply rolling a futures position can erode returns over time—even if the spot price remains unchanged.
Figure 1: Deferred contract performance relative to front month
Commodity | 3-months deferred | 6-months deferred | 12-months deferred |
|---|---|---|---|
Aluminum | 1.4% | 2.2% | 1.8% |
Brent Crude | 1.4% | 2.5% | 0.4% |
Coffee | 1.3% | 2.3% | 2.4% |
Copper | 1.9% | 2.6% | 1.0% |
Corn | 2.9% | 3.8% | 4.5% |
Cotton | 4.3% | 3.9% | 6.0% |
Gasoil | 1.0% | 1.2% | 0.2% |
HRW Wheat | 2.0% | 4.2% | 5.6% |
Lead | 0.9% | 0.7% | 1.1% |
Lean Hogs | 8.6% | 13.1% | 13.0% |
Live Cattle | 2.9% | 3.6% | 3.1% |
Natural Gas | 14.2% | 21.9% | 24.3% |
Nickel | 1.4% | 2.2% | 1.0% |
Soybean | 0.8% | 0.8% | |
Soybean Meal | -0.1% | -0.3% | |
Soybean Oil | 1.8% | 2.5% | |
SRW Wheat | 3.2% | 5.9% | |
Sugar | 3.2% | 5.9% | 5.9% |
ULS Diesel | 2.2% | 3.0% | -0.7% |
WTI Crude | 8.0% | 9.4% | 7.7% |
Zinc | 1.7% | 2.5% | 2.2% |
Source: WisdomTree, Bloomberg. The table shows the difference in annualised performance between the front month BCOM strategy for each commodity within the BCOM basket (except Gold and Silver) and the corresponding deferred contract strategy. 3 and 6-months deferred indices are Bloomberg indices, while 12-months deferred indices are S&P GSCI Indices. The start date for the 3-month column is 03/01/2000; the start date for the 6-month column is 02/01/2001; the start date for the 12-month column is 12/12/2010. End date is 02/04/2025. Historical performance is not an indication of future performance and any investments may go down in value.
Historically, the cost of carry at the front end of the commodity futures curve has been substantially higher than at longer maturities. In other terms, holding the front month futures contracts has resulted in worse performances than holding deferred contracts for the same commodity. This occurs due to several theoretical reasons, including higher annualised storage expenses in initial periods, a convenience yield that decreases with longer maturities flattening the curve, and hedging and speculative activities concentrated in front-month contracts.
Empirically, investing in deferred contracts has demonstrated significant advantages. Figure 1 shows the difference in annualised performance between deferred contracts and front-month contracts, using the commodities within the Bloomberg Commodity Index ex-Precious Metals (BCOMXPM) as a reference2.
Except for Soybean Meal and 12-month ULS Diesel, every commodity analysed exhibited outperformance when investors moved away from front-month contracts and into deferred maturities. This confirms the presence of a carry premium embedded in the structure of commodity futures curves and shows that positioning further out on the curve where the cost of carry tends to be lower. The effect is particularly pronounced in commodities like Natural Gas, where structural characteristics—such as high seasonality, volatile spot prices, and storage constraints—have historically contributed to very steep contango and thus a significant negative roll yield in the front months.
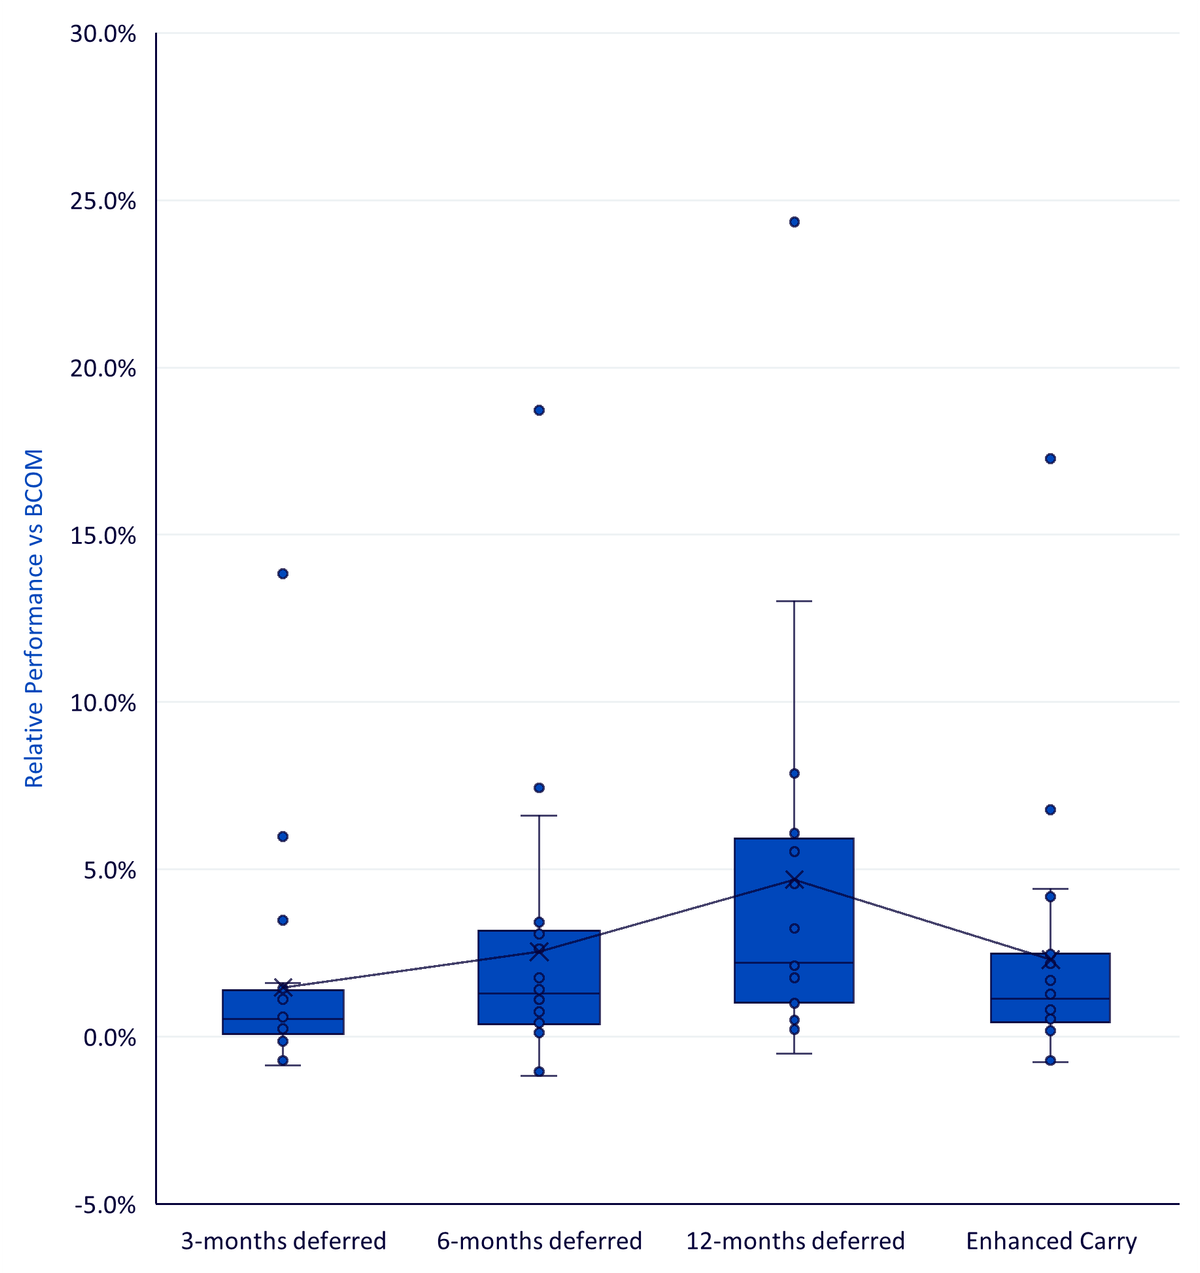
Also, the carry premium tends to increase with maturity—the longer the deferral (that is, moving from 3- to 6- to 12-month deferred contracts), the higher the average outperformance. Figure 2 plots the annualised relative performance of deferred contracts versus BCOM front-month contracts, aligning the start date for each commodity to enable fair comparison. We can see how the outperformance grows systematically as the deferral increases, reinforcing the idea that positioning further along the curve can enhance returns.
Harvesting the premium
To capture this premium, WisdomTree recently launched the WisdomTree Enhanced Commodity Carry ETC (CRRY)3 , which tracks the BNP Paribas Enhanced Commodity Carry Total Return Index. The index seeks to isolate and harvest the premium by going short front-month futures (with high carry cost) and long a basket of deferred contracts (lower carry cost), using the same commodity weights as BCOM ex-Precious Metals both on the long and on the short side.
How is the long leg built? Performance isn't the only factor to take into consideration—liquidity matters too. While deferred contracts offer better carry, they’re generally less liquid. To balance these considerations, the long leg of the index is strategically split for every commodity in the index, applying the same deferral structure consistently across the entire basket:
We can see how this contract selection rule fared in the last column of Figure 2, where each dot represents the outperformance of this enhanced strategy versus the BCOM front-month contract. While there may be a slight compromise in performance compared to using only the most deferred contracts, nearly all commodities still delivered superior returns by a comfortable margin relative to front-month positioning. This highlights the effectiveness of a balanced deferral approach in capturing the carry premium while managing liquidity considerations.
The short leg, where liquidity is less of a concern due to higher trading volumes, invests entirely in front-month future contracts.
The Index applies a 3x leverage on both legs, reset monthly, to effectively capture and amplify the carry differential4.
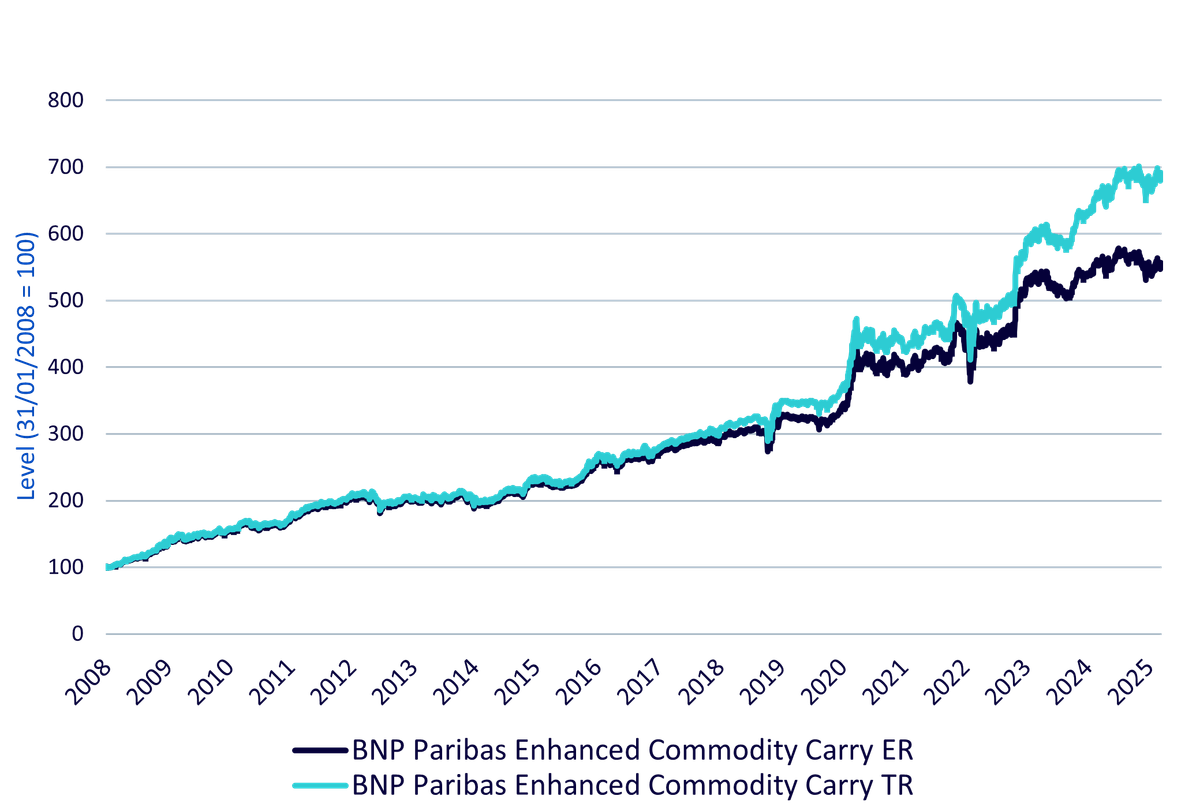
Visualising the strategy
Figure 3 illustrates the historical performance of the strategy over the past 17 years. What stands out is the consistency of returns, especially during market stress events (for example, post-COVID-19). The strategy tends to underperform when the front of the curve rallies rapidly—as seen during the inflationary shock in early 2022—but overall delivers robust returns.
This systematic, rules-based strategy efficiently harvests roll yield and provides a distinct, low-correlation source of alpha within the commodity space.
In an investment landscape where alpha sources are increasingly scarce, the WisdomTree Enhanced Commodity Carry ETC offers a differentiated and data-driven approach to tapping structural pricing dynamics in futures markets. By focusing on where you invest along the curve—not just what you invest in—this strategy provides investors with an elegant way to diversify return streams without taking a directional commodity bet.
1This definition is based on the widely accepted and empirically supported "Theory of Storage," which explains commodity futures pricing by focusing on the costs and benefits of holding physical commodities. Although other theories attempt to explain the futures curve's shape, they are beyond the scope of our current discussion.
2Gold and silver are excluded because of their extremely efficient curve shape.
3ETC = exchange-traded commodity.
4Risk Management - A built-in floor mechanism guarantees a delta-1 exposure, ensuring that the index level never becomes negative.
WisdomTree Enhanced Commodity Carry

Associate Director, Quantitative Research at WisdomTree in Europe
Luca is an Associate Director in WisdomTree Europe's Research team, where he conducts quantitative research to enhance or develop new investment strategies, particularly in commodities and thematic equities. He also focuses on portfolio construction and optimisation. Before joining WisdomTree in 2022, Luca worked as a Quantitative Portfolio Manager at Euclidea SIM, a Milan-based fintech where he quantitatively managed multi-asset portfolios and developed and implemented statistical and machine learning models for investment strategies and fund selection. Luca holds a Master's degree in Finance from Bocconi University, Milan.