

What Is the Beta for Smart Beta?
Published June 1, 2017

Vice President of Strategic Research at Venn by Two Sigma
The terms “smart beta” and “factor investing” have taken the industry by storm of late. At the same time, recent fiduciary pressures and the serial underperformance of actively managed strategies versus beta have been shepherding investors away from active management and into passively managed exchange-traded funds (ETFs).1 Smart beta ETFs have thus provided a potential solution to those still seeking alpha, but with the desire to do it broadly, passively, inexpensively2 and in a well-diversified manner. With that being said, the smart beta indexes that many of these ETFs track are not broad and diversified market exposures. In fact, many are instead concentrated positions seeking to maximize desired factor exposures. While these may be “smart,” are they really “beta”?
What Is Tracking Error and Why Does It Matter?
One helpful way to answer that question is through the statistic known as tracking error. For many, tracking error inhabits the hazy world of both understood and misunderstood, where we know basically what it means but perhaps can’t explain it. In short, tracking error is the standard deviation of excess return versus a benchmark. So, the more an index’s returns are like the benchmark, the lower the tracking error would be, and vice versa. In general, the industry has accepted the 4% to 7% range to be the typical tracking error of actively managed strategies, while below 2% would be more “beta-like.”
The WisdomTree Earnings Index, for example, selects from a total market universe of U.S. companies with positive trailing 12-month earnings and weights them by their share of aggregate earnings paid. Not only does this give you exposure to academically proven alpha generators such as the value and quality factors, but also 1,864 stocks with more than $22 trillion of market capitalization.3 This broad and inclusive methodology, one would expect, has the potential to behave very similarly to traditional beta indexes, implying a low tracking error while also providing the potential for alpha
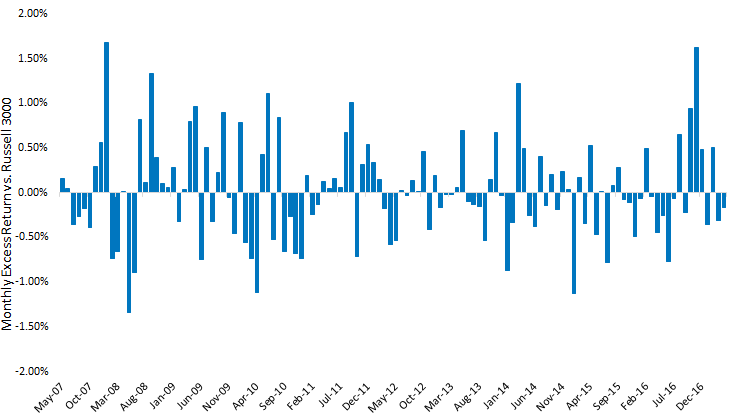
In the chart below, we observe the excess return of the WisdomTree Earnings Index versus the Russell 3000 Index every month. These monthly differences are the “meat” of the tracking error calculation and help identify how “beta” an index actually is. As you can see, the WisdomTree Index over the last decade has been within 2% of the Russell 3000 monthly return 100% of the time.
WisdomTree Earnings Index Monthly Excess Return vs. Russell 3000
For definitions of terms in the chart, visit our glossary.
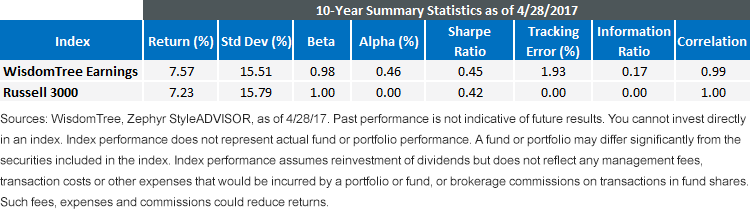
When you take the standard deviation of these monthly returns, you are left with a tracking error of 1.93% versus the Russell 3000 Index, a below 2% outcome. We also see that the WisdomTree beta is 0.98, and the correlation is 0.99, both indicating that the WisdomTree Earnings Index has behaved very much like beta over the last decade.
What is the meaningful difference between these Indexes if not their behavior? Over this 10-year period, the WisdomTree Earnings Index added, on average, 34 basis points (bps) per year over the Russell 3000 Index. This, combined with its lower volatility, led it to have a higher Sharpe ratio, a measure of risk-adjusted returns. Now, to be clear, with a tracking error this low, the alpha potential versus the market is limited. We do not dispute that a smart beta index with 6% or 9% tracking error does have the potential to outperform beta by much greater margins, but it also means that there is potential for greater underperformance as well. This non-beta experience over time, for advisors, may introduce career risk.
Conclusion: Occam’s Razor
Occam’s razor is often used as evidence that simplicity is key. With that being said, we believe that the WisdomTree Earnings Index does not try to act smarter than it really is. It behaves like beta, but tilts toward alpha. It includes only profitable companies and weights them by their share of earnings. That’s it. It is a simple yet elegant re-engineering of broad market exposure, and one that has been tracked by an investable ETF for more than a decade (The WisdomTree Total Earnings Fund, EXT). To us, there are two ways to consider “what is beta for smart beta?” The first is a multifactor approach, providing consistent exposures to multiple factors over time, but the second is an index that truly looks and feels like beta, or broad diversified market exposure, and does it in a way that seeks to provide alpha.
1S&P Dow Jones SPIVA Scorecard.
2Ordinary brokerage commissions apply.
3Source: WisdomTree, as of 5/18/17.
Important Risks Related to this Article
There are risks associated with investing, including possible loss of principal. Funds focusing their investments on certain sectors increase their vulnerability to any single economic or regulatory development. This may result in greater share price volatility. Please read the Fund’s prospectus for specific details regarding the Fund’s risk profile.
Diversification does not eliminate the risk of experiencing investment losses.
Categories
About the contributor
