

What Dividend Trends Say about the Market’s Gains
Published January 20, 2015

Global Chief Investment Officer
Recently, a hotly debated question has been whether U.S. equities are expensive or approaching so-called “bubble” territory. Anytime equities are viewed as relatively cheap or expensive, it is important to note the characteristic being used to make that determination. The most widely cited characteristic that is used to stipulate that stocks are expensive is the price-to-earnings (P/E) ratio. While the P/E ratio is an important valuation metric, we do not think it should be the only metric used. We suggest that an intuitive framework for answering this question could be comparing price performance (upward or downward movement of stock prices that does not account for dividend payments) to dividend growth. WisdomTree conducts the annual rebalance of its U.S. dividend Index family in December, with the annual screening date occurring on the last trading day of November. The annual screening process provides a plethora of data about how dividends for the U.S. equity markets have changed over time and gives us important information about the underlying market fundamentals. In figure 1, we look at the Dividend Stream® for the WisdomTree Dividend Index (WTDI), WisdomTree’s broadest and most inclusive dividend Index, and compare it with the price changes for WTDI and the Russell 3000 Index. Figure 1: Annual Dividend Stream ($ Billions): WisdomTree Dividend Index
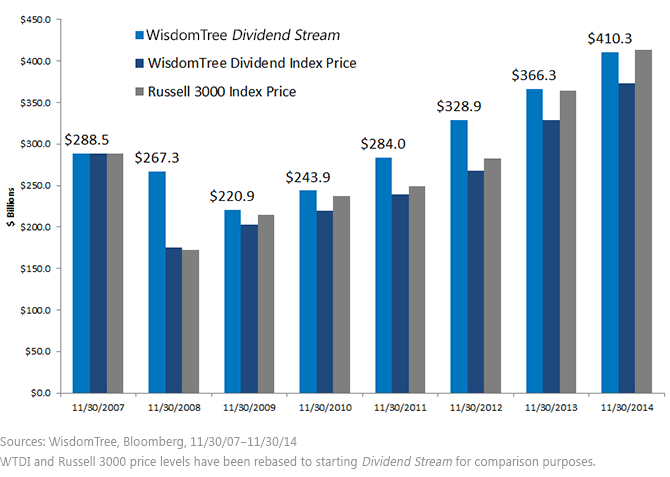
• Record Dividend Stream Supports Prices: In 2007, the WisdomTree Dividend Index recorded what remained until November 30, 2012, its peak level of $288.5 billion. At the 2014 rebalance screening, seven years later, a new peak of $410.3 billion was recorded. This indicates approximately 42.2% cumulative growth in the indicated Dividend Stream over the period. • Price Change Matches Dividend Growth: We find it interesting that the Russell 3000 Index price change over the same period was 43.3%. This is one way to signal that market prices have moved in tandem with dividends over the last seven years; prices did not increase relative to dividends.1 Can Dividend Growth Continue? Firms that are not paying out all of their cash as dividends are increasingly buying back their own stock, which can lead to share reduction if their buybacks are greater than issuance. This is important to consider because those who assume that future dividend growth is going to "mean revert" and trend back to historical levels—thus supporting a claim that the market is expensive, given its below-average dividend yields —are not accounting for the net buybacks, which could be locking in future dividend growth. Figure 2: Net Buyback Yield Greater than 2% for Four Years in a Row, Supporting Dividend Growth
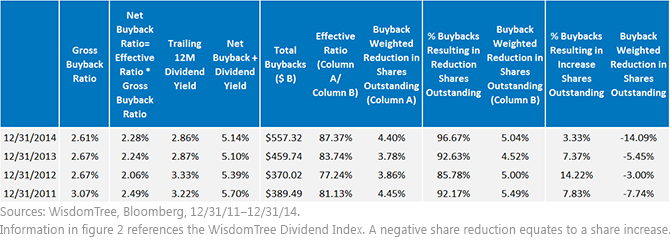
• For WTDI, the net buyback ratio was approximately 2.3% in 2014, and the combined dividend yield and net buyback ratio was over 5.1% for each of the last four years. • If you consider the combined dividend yield plus net buybacks ratio, it is actually higher than the average dividend yield since 1871.2 This, we think, is very supportive of current valuations. • Companies whose buybacks reduced shares outstanding had a weighted average reduction in shares outstanding of between 4.5% and 5% in each of the last four years, and only 3%‒14% of all buybacks conducted in these years resulted in share counts creeping higher. When comparing the gross buybacks (total amount) to the net amount that resulted in share counts declining, we find that share buybacks have been very effective in the last four years. Share buybacks that reduce share count lock in per-share dividend growth. Firms can distribute the same dollar value of aggregate dividends in the future, but, since it is spread out over fewer shares, they mathematically increase their per-share dividends. If recent buyback trends continue—and we expect they will—this suggests that dividend growth is apt to be higher than its long-term historical norms. 1The price change for WTDI was only 29.3%. We used the Russell 3000, which had a larger increase, to illustrate price changes as a better way to capture companies that initiated a dividend and added to the U.S. equity market Dividend Stream but not necessarily to the price of WTDI. 2Source: Robert Shiller, as of 12/31/14.
Important Risks Related to this Article
Dividends are not guaranteed, and a company’s future ability to pay dividends may be limited. A company currently paying dividends may cease paying dividends at any time.
About the contributor

Global Chief Investment Officer
Jeremy Schwartz has served as Global Chief Investment Officer since November 2021 and leads WisdomTree’s investment strategy team in the construction of WisdomTree’s equity Indexes, quantitative active strategies and multi-asset Model Portfolios. Jeremy joined WisdomTree in May 2005 as a Senior Analyst, adding Deputy Director of Research to his responsibilities in February 2007. He served as Director of Research from October 2008 to October 2018 and as Global Head of Research from November 2018 to November 2021. Before joining WisdomTree, he was a head research assistant for Professor Jeremy Siegel and, in 2022, became his co-author on the sixth edition of the book Stocks for the Long Run. Jeremy is also co-author of the Financial Analysts Journal paper “What Happened to the Original Stocks in the S&P 500?” He received his B.S. in economics from The Wharton School of the University of Pennsylvania and hosts the Behind the Markets podcast. Jeremy is a member of the CFA Society of Philadelphia.