

U.S. Treasuries: Trouble with the Curve
Published January 3, 2018

Head of Investment and Fixed Income Strategy
In my opinion, one of the more widely discussed topics in 2018 will be the shape of the U.S. Treasury (UST) yield curve. This is a development I highlighted on a periodic basis throughout the course of 2017, and I offered our latest insights in a November 29 blog post, “U.S. Treasuries: The World Is Flat After All…At Least for the Yield Curve.”
The focus this time around will be on what, if anything, is the recent flattening of the yield curve trying to tell us? There are a variety of yield curve relationships to choose from, but perhaps one of the more closely followed for Treasuries is the 2-Year versus 10-Year maturity. While this gauge has not yet moved into inverted territory (2-Year yield > 10-Year yield), it appears as if the expectation for 2018 among bond investors is that this is where the yield curve could eventually wind up. Why is this important? Because history has shown that inverted yield curves have typically preceded recessions, and given the length of the current economic recovery, concerns have arisen as to its sustainability going forward, with any signal that a potential downturn could be on the horizon getting extra attention.
UST 2-Yr/10-Yr Spread
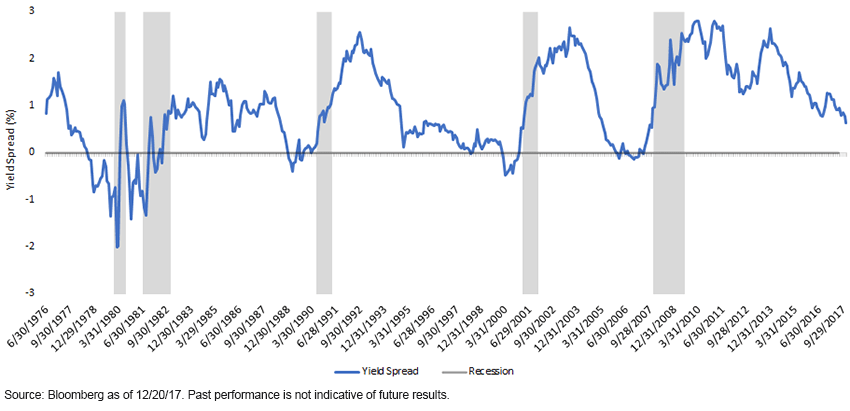
The general school of thought is that an inverted yield curve indicates a pending recession in about a year’s time. It certainly is not a perfect science in this regard, but it has definitely served as a rather useful predictive tool, as I mentioned above. In fact, over the last 40 years, the only time an inverted UST 2/10 spread did not “predict” a recession roughly 12 months out was in 1998: The spread went into negative territory around midyear 1998, but according to the National Bureau of Economic Research (NBER), the unofficial keeper of business cycles, the subsequent downturn didn’t begin until Q1 2001. According to a report from the Federal Reserve (Fed) of Cleveland, utilizing the UST three-month t-bill versus the UST 10-Year note spread, it estimated “the expected chance of the economy being in a recession next October at 11.8 percent” and stated, “the yield curve is optimistic about the recovery continuing, even if it is somewhat pessimistic with regard to the pace of growth over the next year."1
In our aforementioned blog post, we addressed how the yield curve flattened in 2017, but let’s take it one step further. In other words, is this most recent narrowing trend following past cycles, or could there be a new dynamic to consider (unprecedented global quantitative easing and its impact on rates). This is extremely important in determining whether the current flattening trend continues, and also if this flattening episode could be a precursor yet again for a potential recession.
We know the one key factor at work has been the Fed rate hike impact on the UST 2-Year yield, but what about the other aspect of the curve, the UST 10-Year yield? In the past, the 10-Year note would have been impacted by Fed policy being viewed as restrictive, with the rate hikes attempting to slow the economy and ward off inflation pressures. Just the opposite is occurring now, as the Fed is not trying to achieve either of those two goals. In fact, the lack of inflation and attendant expectations have been mystifying the policy makers. Interestingly, Fed Chair Janet Yellen outlined similar thoughts at the December FOMC presser. Despite the Fed’s rate increases and balance sheet normalization plans, monetary policy is still not restrictive, and when combined with the balance sheet expansion by the Bank of Japan and the European Central Bank (ECB), global financial conditions are actually very accommodative. As a result, developed markets’ sovereign debt yields outside the U.S. have remained artificially low, making dollar-based investments like the UST 10-Year note rather attractive on a relative value basis.
Conclusion
So what does the future hold for the yield curve? Interestingly, the flattening trend came to an abrupt halt the week before Christmas, and actually reversed course and steepened. After reaching a 2017 low point of 51 basis points (bps) on December 15, the 2/10 spread widened out 13 bps to 64 bps in less than one week’s time. This bout of steepening was essentially the result of a global sell-off in longer-dated sovereign debt, with the UST 10-Year yield backing up 15 bps in the process to 2.50%.
Was this sell-off a sea change in attitude? Probably not. Oftentimes, as year-end approaches, investors pare back position bets and move to a more neutral state. Certainly, the passage of the Tax Cuts and Jobs Act created a landscape where economists were revising upward their GDP forecasts, as well as Treasury supply needs for 2018—two potential influences bond investors will have to monitor going forward. However, there has not been an attendant increase of visible proportion in inflation expectations or a shift in the monetary policy outlook for the ECB, and until that changes, it seems reasonable to expect the flattening trade to resume and not necessarily indicate that the next recession could be a mere 12 months away.
Unless otherwise noted, data source is Bloomberg as of December 20, 2017.
1"Yield Curve and Predicted GDP Growth,” Federal Reserve Bank of Cleveland, 11/17.
Categories
About the contributor

Head of Investment and Fixed Income Strategy
Kevin serves as the Head of Investment and Fixed Income Strategy. In this role, he writes macro and fixed income-related content and works closely with the sales, research and marketing teams. In addition, Kevin conducts client-facing webinars and meetings, providing expertise on WisdomTree’s existing and future bond ETFs. Prior to joining WisdomTree, Kevin spent 30 years at Morgan Stanley, where he was Managing Director and Chief Fixed Income Strategist for Wealth Management. He was responsible for tactical and strategic recommendations and created asset allocation models for fixed income securities. He was a contributor to the Morgan Stanley Wealth Management Global Investment Committee, primary author of Morgan Stanley Wealth Management’s monthly and weekly fixed income publications, and collaborated with the firm’s Research and Consulting Group Divisions to build ETF and fund manager asset allocation models. Kevin has an MBA from Pace University’s Lubin Graduate School of Business, and a B.S. in Finance from Fairfield University.