

U.S. Growth: Trick or Treat?
Published October 31, 2018

Head of Investment and Fixed Income Strategy
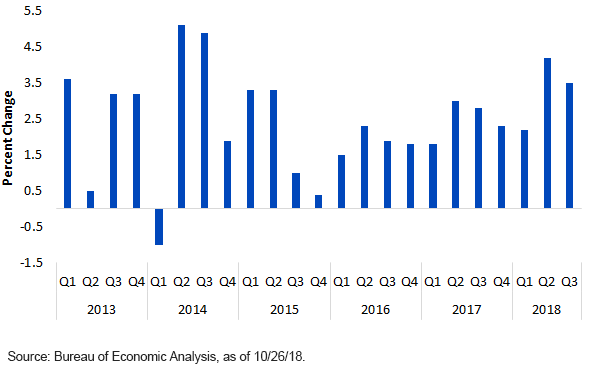
Following the advanced release of the second-quarter 2018 real GDP report, there were many questions as to whether that robust performance was sustainable or just another one-quarter phenomenon. Well, the results are in and growth not only did not disappoint, but Q3 real GDP actually came in a bit stronger than expected at +3.5%. Interestingly, these back-to-back rather solid quarterly results did not quell the economic naysayers, as the conversation shifted more toward, “This is the peak in activity and an eventual slowdown is looming.” In other words, given that today is Halloween, do you fall in the “trick” camp or the “treat” camp?
Three months ago, I blogged on this very topic (not Halloween, but the U.S. economy), “U.S. Econ Watch: Expanding Your Horizons,” so it seems only fitting to explore it yet again, and hopefully provide the reader with some useful nuggets to help you decide what you may receive after you ring that doorbell. Last time around, I looked beyond the headline growth figure and instead turned the focus to the underlying components, or the five cylinders of the GDP engine: personal consumption expenditures (PCE), gross private domestic investment, change in private inventories, net exports of goods and services and government spending and investment.
U.S. Real GDP
Personal Consumption Expenditures: Once again, PCE was the most noteworthy component of overall growth. In Q3, the annual growth rate for PCE came in at 4.0%, representing its best showing since 2014. This cylinder contributed roughly 2.7% to the overall real gross domestic product (GDP) increase and reflected solid showings for both goods and services. Treat.
Gross Private Domestic Investment: This category consists of both residential and nonresidential investment. Nonresidential, or business, investment experienced a pronounced slowing from Q2, posting a modest increase of only 0.8% versus 8.7% three months prior. The residential grouping was clearly a disappointment, falling 4.0%, the third consecutive quarterly contraction. Higher mortgage rates appear to be dampening housing activity, a development that could linger in the period ahead. Trick.
Change in Private Inventories: Remember, this cylinder can act as a wild card in any given quarter, specifically because in the advanced GDP report, the Bureau of Economic Analysis (BEA) does not have full data but makes estimates instead. For Q3, inventories proved to be the pleasant surprise, adding 2.1% to growth after subtracting 1.2% last quarter. As you can see, visible swings tend to happen in this category on a quarterly basis, so the verdict for Q4 is open for debate. Trick or Treat.
Net Exports of Goods & Services: Another one of the wild-card categories. Once again, full data for the quarter has not yet been reported, and BEA needs to fill in the blanks. Net exports came in on the negative side of the ledger in Q3, deleting 1.8% from real GDP, more than reversing last quarter’s 1.1% contribution. Exports themselves plunged 3.5%, the first outright decrease since 2016. Given the ongoing uncertainties surrounding trade in general, it seems more than likely that this cylinder could remain a headwind going forward. Trick.
Government Spending & Investment: Rounding out our list is the grouping that includes federal, state and local figures. Both areas came in on the plus side of the ledger in Q3, registering a combined gain of 3.3%. The federal level was boosted by another robust gain of 4.6% in defense spending. Given the increase of more than $1.0 trillion that was included in the fiscal year 2018 Omnibus Spending Bill, future support from the federal government category would appear more than likely, coming in the areas of both defense and domestic discretionary spending. Treat.
Conclusion
Through the first three quarters of this year, growth has averaged a 3.3% pace, appearing to set a nice glide path for a visible improvement from the 2017 tally of +2.2%. While 2018 is not even in the books yet, the discussion seems to be tilting toward next year already. If you fall into the trick camp, you will be highlighting the potential adverse impacts of Federal Reserve (Fed) rate hikes and quantitative tightening, as well as the reduced effects of this year’s tax cuts. Conversely, further PCE momentum and government spending make you hopeful for that treat getting thrown into your bag instead. Consensus forecasts look for real GDP to drop back to a 2.5% gain in 2019. If this projection does come to fruition, I’d consider that a treat, certainly not along the lines of “I got a rock.”
Unless otherwise stated, all data sourced is Bureau of Economic Analysis as of October 26, 2018.
Categories
About the contributor

Head of Investment and Fixed Income Strategy
Kevin serves as the Head of Investment and Fixed Income Strategy. In this role, he writes macro and fixed income-related content and works closely with the sales, research and marketing teams. In addition, Kevin conducts client-facing webinars and meetings, providing expertise on WisdomTree’s existing and future bond ETFs. Prior to joining WisdomTree, Kevin spent 30 years at Morgan Stanley, where he was Managing Director and Chief Fixed Income Strategist for Wealth Management. He was responsible for tactical and strategic recommendations and created asset allocation models for fixed income securities. He was a contributor to the Morgan Stanley Wealth Management Global Investment Committee, primary author of Morgan Stanley Wealth Management’s monthly and weekly fixed income publications, and collaborated with the firm’s Research and Consulting Group Divisions to build ETF and fund manager asset allocation models. Kevin has an MBA from Pace University’s Lubin Graduate School of Business, and a B.S. in Finance from Fairfield University.