

Treasury 10-Year Yield: A Case of “Higher Highs”
Published April 7, 2021

Head of Investment and Fixed Income Strategy
Can you believe it? The first quarter of 2021 is now in the books, and it certainly provided some headline-making material for the bond market. Specifically, I’m talking about the rise in the U.S. Treasury (UST) 10-Year yield, of course—and really, who isn’t talking about this development? Now the question becomes: Where is it headed next?
If you’ve been reading my blog posts, you probably know my thoughts on the matter. Let’s recap… What could be some key driving forces behind an ascent to even higher ground?
- Unprecedented fiscal stimulus, with potentially another huge package coming “down the pike”
- Unique monetary policy where the Federal Reserve (Fed) doesn’t raise rates until the economy and inflation have actually surpassed targeted thresholds
- Inflation expectations rising to a decade high in some cases
- Market “indigestion” due to enormous increases in Treasury coupon auction sizes
- Key technical support levels being breached
U.S. 10-Year Treasury Yield
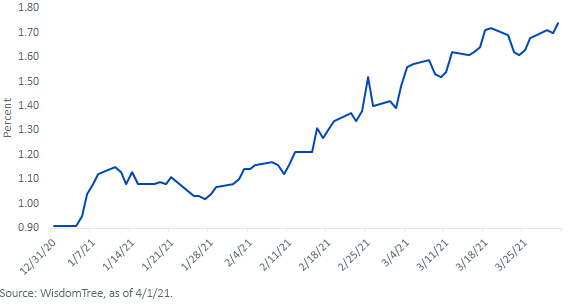
The five factors I listed are just what logically comes to mind. However, another interesting development has been appearing on my radar of late, and it involves actual trading activity in the UST 10-Year. No, don’t worry, I’m not going to go down any “rabbit holes” or get too far “down into the weeds,” but nevertheless, I think the reader may find the trends I’ve been noticing indicative of how the 10-Year yield could potentially move higher.
Take a look at this graph of the UST 10-Year yield for Q1. Obviously, what first comes to mind is the 80 basis points (bps) increase. But look a little closer, and you’ll see a pattern developing: Each time the yield moves noticeably higher, it then retraces back by roughly 15 bps before making another new high watermark. The two most recent instances are what caught my attention specifically.
- In late February, the yield broke through the 1.50% threshold, then fell back down to 1.39% before rising to a “new” high threshold of 1.75% in mid-March.
- After hitting this near-term peak a couple weeks ago, the yield then fell to 1.59% before increasing yet again to 1.77%.
What Could Investors Expect Next
If this trend were to hold, the UST 10-Year yield would seemingly be poised to break through the next Fibonacci five-year retracement level of 1.79%. And you know what could come next…2.13%. Now, as this blog piece is trying to point out, a potential move above the 2% threshold would not necessarily be a “one-way” street, as the illustrated “seesaw” pattern would more than likely still be operative. However, continued investor behavior of “selling into strength” could ultimately lead the 10-Year yield to continue making “higher highs.”
Categories
About the contributor

Head of Investment and Fixed Income Strategy
Kevin serves as the Head of Investment and Fixed Income Strategy. In this role, he writes macro and fixed income-related content and works closely with the sales, research and marketing teams. In addition, Kevin conducts client-facing webinars and meetings, providing expertise on WisdomTree’s existing and future bond ETFs. Prior to joining WisdomTree, Kevin spent 30 years at Morgan Stanley, where he was Managing Director and Chief Fixed Income Strategist for Wealth Management. He was responsible for tactical and strategic recommendations and created asset allocation models for fixed income securities. He was a contributor to the Morgan Stanley Wealth Management Global Investment Committee, primary author of Morgan Stanley Wealth Management’s monthly and weekly fixed income publications, and collaborated with the firm’s Research and Consulting Group Divisions to build ETF and fund manager asset allocation models. Kevin has an MBA from Pace University’s Lubin Graduate School of Business, and a B.S. in Finance from Fairfield University.