

There Is Acute Pain inside the NASDAQ
Published January 24, 2022

Head of Equity Strategy
There are 85 members of the S&P 500 trading for more than 10 times sales. For context, Jesse Felder’s eponymous Felder Report counted “only” 27 stocks trading at that multiple at the peak of the dot-com bubble.
If you think that’s a lot, consider that the NASDAQ 100 has 46 such stocks, with a handful—namely NVIDIA and Tesla—trading north of 30x sales.
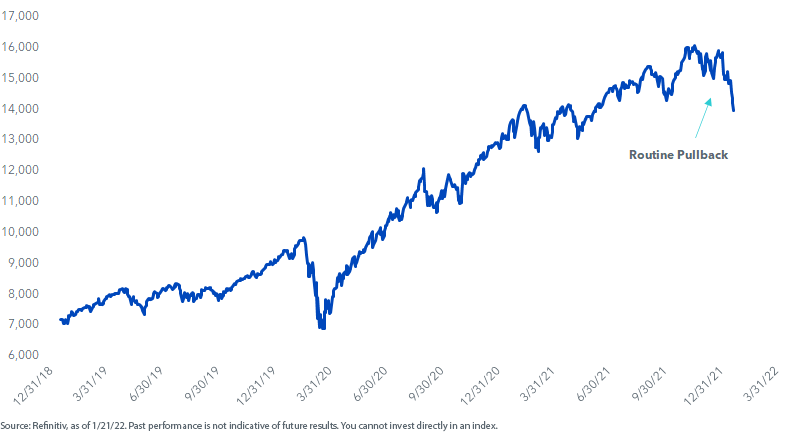
It may come as a surprise to you that there are so many stocks still priced like this, especially since there has been some real carnage in the market for more than three months. Sure, you wouldn’t know the sheer extent of it from looking at the NASDAQ’s correction (figure 1), but hundreds of stocks have witnessed their share prices collapse.
Figure 1: NASDAQ Composite
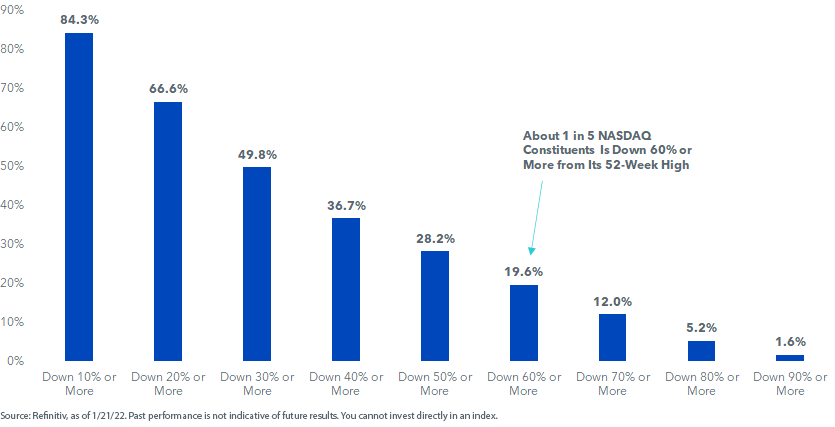
How bad is it? Of the NASDAQ Composite’s 3,000+ companies, about half are down 30% or more from their 52-week highs. About one in five has declined—gulp—60% or more (figure 2).
Figure 2: Percentage of Members Declining from 52-Week Highs
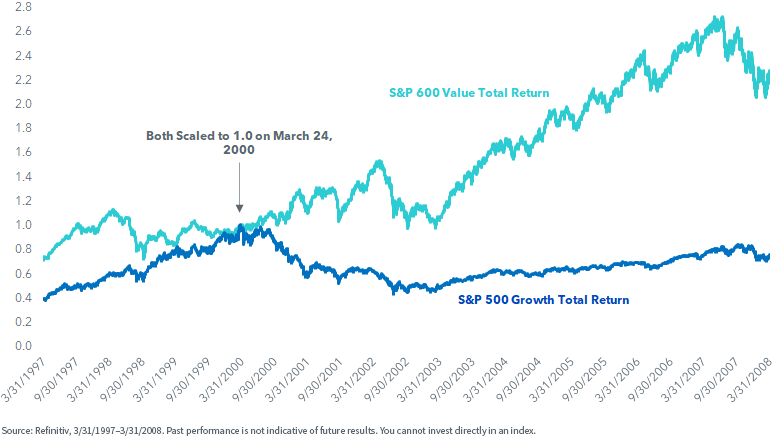
In figure 3, I took the best-performing style box of the late 1990s—large-cap growth—and plotted it against the laggard of the era, small-cap value. Scaling both to 1.0 on March 24, 2000, you can see growth stocks’ many years in the wilderness.
Figure 3: S&P 600 Value vs. S&P 500 Growth, Tech Bubble & Aftermath
In the 2000–2002 bear market, companies that were actively buying back stock held up notably, while those that diluted their shareholders were punished heavily. We run an explicit buyback screen in the WisdomTree U.S. Value Fund (WTV).
Figure 4: U.S. Stock Market Cumulative Loss: 8/31/00–9/30/02.
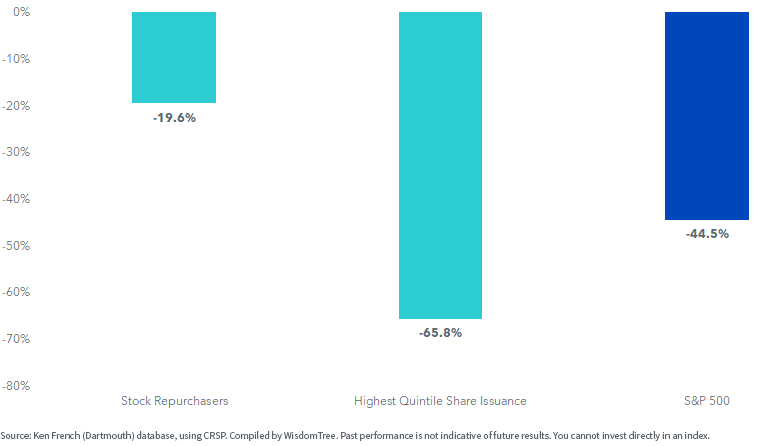
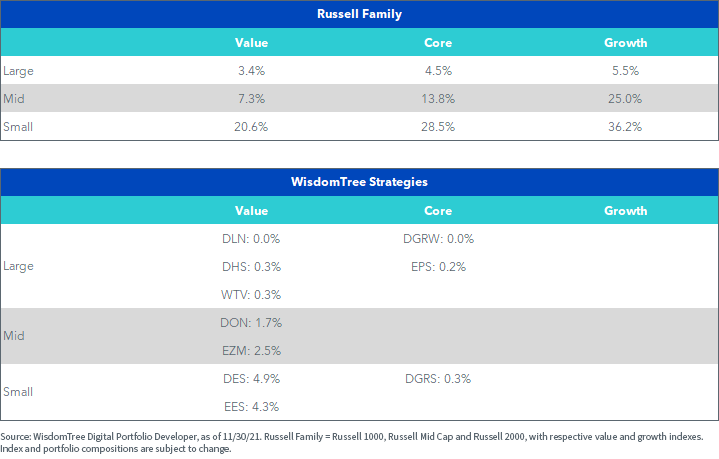
Figure 5 shows the percentage of each Russell Index that is unprofitable, along with a bunch of ETFs that tend to kick out negative earners. All the ones I included were launched in either 2006 or 2007. If your portfolio is lopsided toward small and mid-growth—and you’re thinking this market looks a bit “dot-commy”—this exhibit is a guide.
Figure 5: Percentage of Companies with Negative Earnings
Important Risks Related to this Article
There are risks associated with investing, including possible loss of principal. Funds focusing their investments on certain sectors increase their vulnerability to any single economic or regulatory development. This may result in greater share price volatility. While the Fund is actively managed, the Fund’s investment process is expected to be heavily dependent on quantitative models, and the models may not perform as intended. Please read the Fund’s prospectus for specific details regarding the Fund’s risk profile.
Categories
About the contributor

Head of Equity Strategy
Jeff Weniger, CFA, has been with WisdomTree since 2017 and serves as the Head of Equities. He shapes the firm’s market outlook through a combination of macroeconomic and fundamental analysis. With more than two decades in investment strategy, Jeff is known for his work on market cycles and valuations. Before joining WisdomTree, Jeff was with BMO Private Bank and BMO Global Asset Management for 11 years. At BMO, he sat on the firm’s Asset Allocation Committee and co-managed ETF model portfolios across the U.S. and Canada. In 2013, at age 32, he became the youngest member of BMO’s Global Investment Forum. When he left BMO to come to WisdomTree, his final role was Director, Senior Strategist in the Office of the CIO in 2017.
Jeff is a frequent television guest on networks such as CNBC, Bloomberg, and Schwab, with regular print appearances in The Wall Street Journal, Barron’s and Reuters. He also appears weekly on the Behind the Markets podcast and is a regular on SiriusXM’s The Business Briefing. On X, Jeff has developed one of the larger followings in financial media. He earned a B.S. in Finance from the University of Florida and an MBA from the University of Notre Dame. He has held the CFA charter since 2006.