

The U.S. Stock Market’s Moment(um) of Truth
Published October 21, 2019

Head of Equity Strategy
The stock market is having a moment of truth.
Frequent readers of our blog may note that figure 1 looks like the chart I presented in my August post, which discussed U.S. large-cap growth stocks’ 13-year bout of outperformance. Many growth stocks populate so-called momentum indexes, which own market leaders in the belief that they will keep leading.
When figure 1 is rising, the S&P 500 Momentum Index is getting the better of S&P 500 Value Index, and vice versa.
I circled the December 8, 2016, low in the series, which shows Momentum’s relentless run since then has produced 16.2% annual returns, more than doubling Value's 7.17%. The series is bumping against major resistance from March 2009, the month the global financial crisis stock market declines ended.
Figure 1: Near 10-Year Resistance
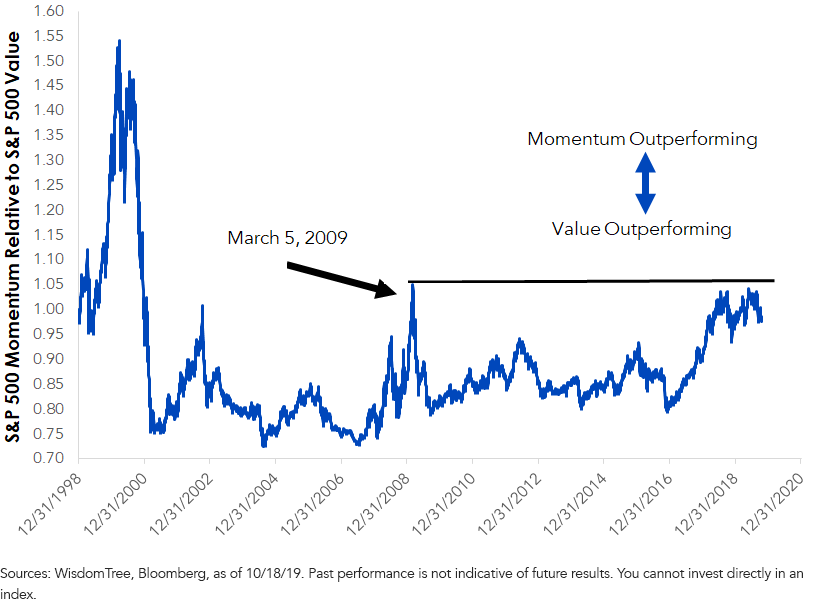
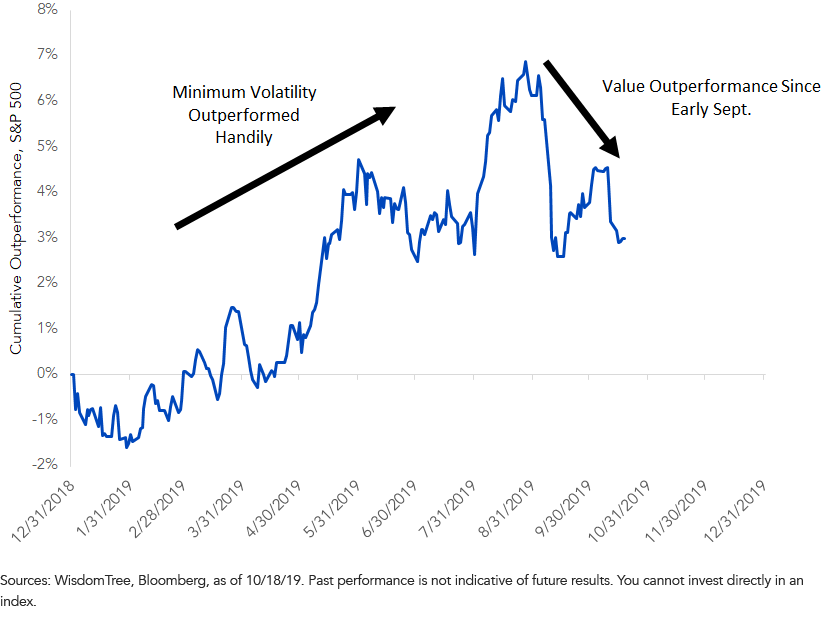
Figure 2 shows the most exciting part of our last few months—and by “our,” I mean all the frustrated Value-investing apologists such as myself.
A two-week window in late August/early September witnessed so-called minimum volatility strategies lose their luster, underperforming Value by 4 percentage points. “Min Vol,” as it is commonly called in the industry, seeks companies with lower stock price movements. It has been a crowd favorite in recent years, much to the chagrin of frustrated Value players.
Figure 2: Value Investors Got Excited in Early September
Something critical to note when researching “Minimum Volatility” is that semantics matter.
Look at the difference between that group’s sector weights and the weights in the similarly named “Low Volatility” index in figure 3.
Make sure to look under the hood.
Figure 3: Factor Index Sector Compositions
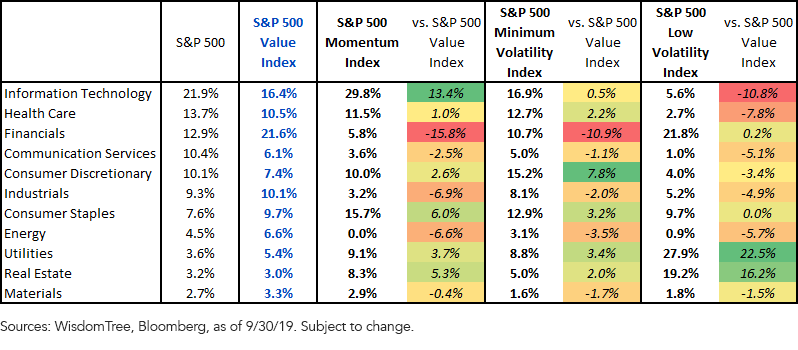
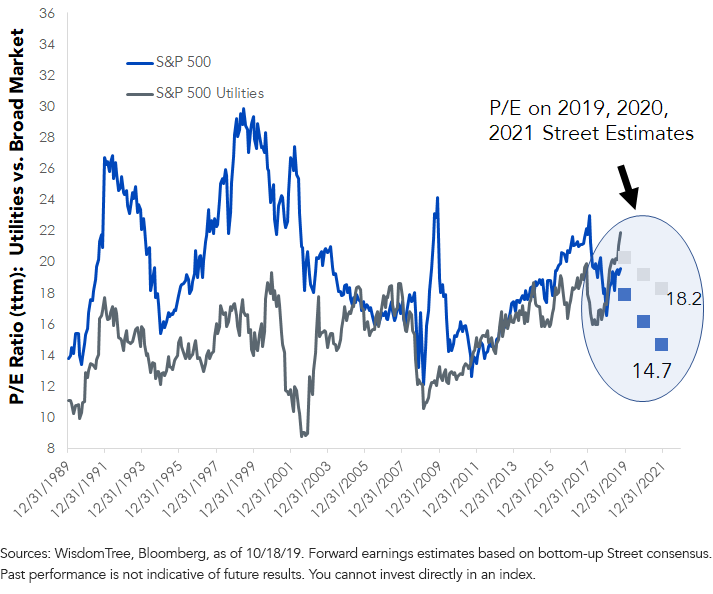
A few observations: Most notable to me is that Momentum, Minimum Volatility and Low Volatility are all decidedly over weight in Utilities relative to its weight in Value. That is important because this staid sector is trading on 2019 and 2020 price-to-earnings (P/E) premiums to the broad market. For 2021, Utilities’ 18.2 P/E is several points higher than the 14.7 accorded to the market (figure 4).
Figure 4: Utilities Trading at a Rare Premium
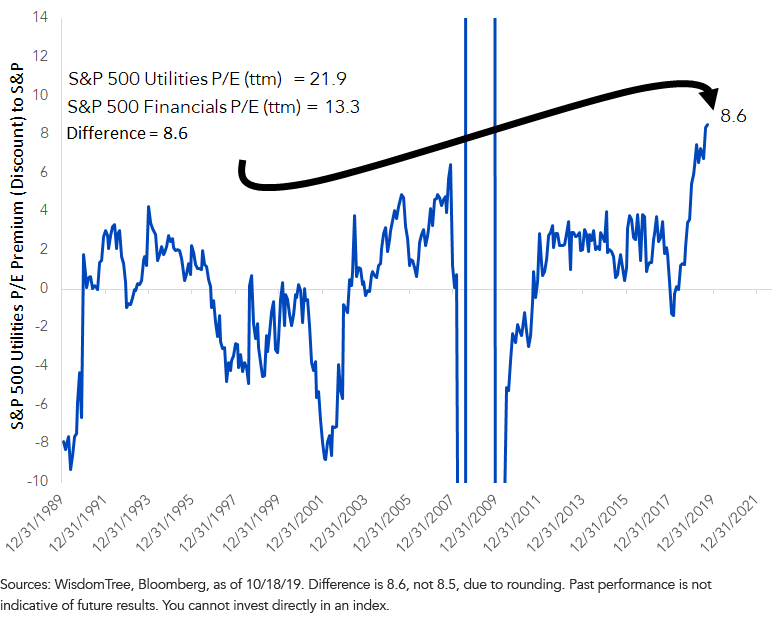
Go back to the green-yellow-red heat map. While the three non-Value “smart-beta” indexes had a lot of Utilities, what they generally avoided was Financials. Utilities’ P/E premium over Financials has no precedent in data to 1989, aside from the global financial crisis years (figure 5).
Figure 5: Utilities’ 2021 P/E Now 8.6 Points Higher Than Financials
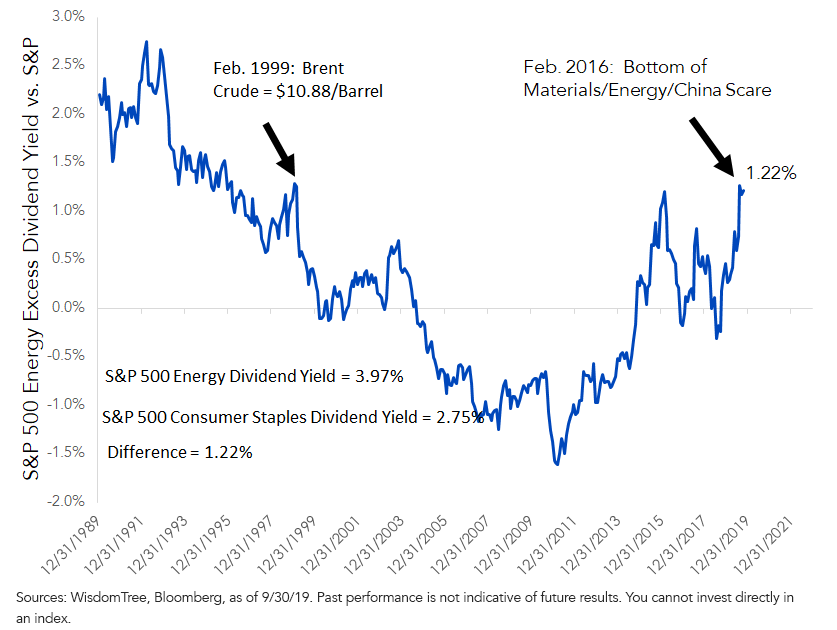
Here’s another pair trade: Consumer Staples versus Energy. A metric that stood out when I pored over the data was the dividend yield gap between the two. Energy’s near 4% dividend is now 1.22% higher than that of Staples (figure 6). We saw this in late-2015/early-2016 when a serious scare hit the Energy and Materials patch. Before that, you have to go back a generation to see this wide of a gap.
Figure 6: S&P 500 Energy Dividend Yield 1.22% Higher Than Consumer Staples
WisdomTree Indexes
As of Q3, in our in-house Indexes, the Consumer Staples sector is under weighted in our earnings-weighting and shareholder yield screens. In contrast, the sector tends to show up heavier in our dividend-focused concepts.
Energy is held in greater size in our dividend-weighted Indexes than earnings-weighted areas like the WisdomTree U.S. LargeCap Index.
For Utilities, there’s zero exposure in the WisdomTree U.S. Quality Dividend Growth Index, which tracks 300 stocks.
Finally, Financials comprise more than a fifth of the WisdomTree U.S. LargeCap Index.
Unless otherwise stated, all data is from Bloomberg, through 10/18/19.
Categories
About the contributor

Head of Equity Strategy
Jeff Weniger, CFA, has been with WisdomTree since 2017 and serves as the Head of Equities. He shapes the firm’s market outlook through a combination of macroeconomic and fundamental analysis. With more than two decades in investment strategy, Jeff is known for his work on market cycles and valuations. Before joining WisdomTree, Jeff was with BMO Private Bank and BMO Global Asset Management for 11 years. At BMO, he sat on the firm’s Asset Allocation Committee and co-managed ETF model portfolios across the U.S. and Canada. In 2013, at age 32, he became the youngest member of BMO’s Global Investment Forum. When he left BMO to come to WisdomTree, his final role was Director, Senior Strategist in the Office of the CIO in 2017.
Jeff is a frequent television guest on networks such as CNBC, Bloomberg, and Schwab, with regular print appearances in The Wall Street Journal, Barron’s and Reuters. He also appears weekly on the Behind the Markets podcast and is a regular on SiriusXM’s The Business Briefing. On X, Jeff has developed one of the larger followings in financial media. He earned a B.S. in Finance from the University of Florida and an MBA from the University of Notre Dame. He has held the CFA charter since 2006.