

Plenty of Price, Not Much Sales
Published April 1, 2021

Head of Equity Strategy
In part 1 of this two-part blog series, “The Bond Market’s Sell-Off Is Taking Out the Stock Market’s Leaders,” I discussed the trouble currently confronting several mega-cap growth companies. Now let’s look across the entire S&P 500.
Last year, I penned a piece called “The Ghost of Sun Microsystems,” digging into the history of one of the tech bubble’s most legendary computer company’s stocks.
The post-Dot-Com-crash reflection of Sun Micro’s CEO, Scott McNealy, is legendary:
Two years ago we were selling at 10 times revenues when we were at $64. At 10 times revenues, to give you a 10-year payback, I have to pay you 100% of revenues for 10 straight years in dividends. That assumes I can get that by my shareholders. That assumes I have zero cost of goods sold, which is very hard for a computer company. That assumes zero expenses, which is really hard with 39,000 employees. That assumes I pay no taxes, which is very hard. And that assumes you pay no taxes on your dividends, which is kind of illegal. And that assumes with zero R&D for the next 10 years, I can maintain the current revenue run rate. Now, having done that, would any of you like to buy my stock at $64? Do you realize how ridiculous those basic assumptions are? You don’t need any transparency. You don’t need any footnotes. What were you thinking?
I guess we could say that Sun Micro had plenty of price, but not much sales.
Today, there are 59 stocks in the S&P 500 that trade at 10 or more times revenue.
Figure 1: Members of the S&P 500 with Price/Sales Ratio > 10
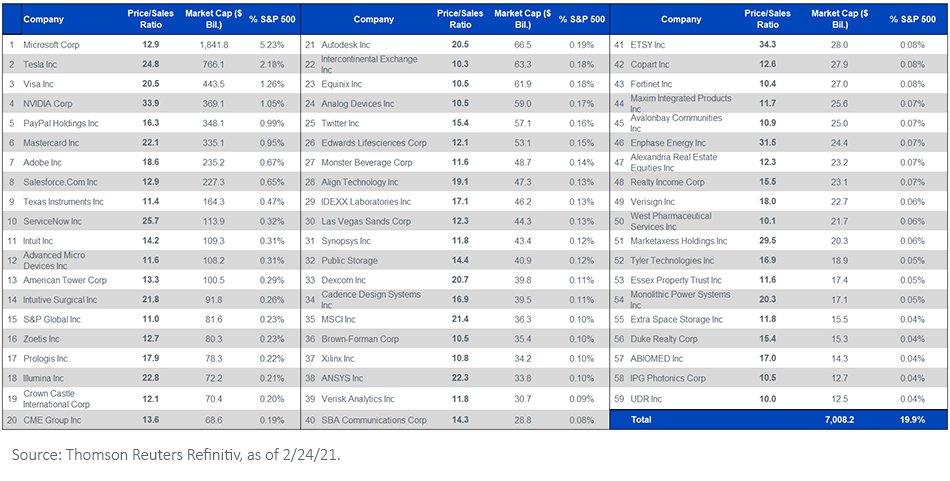
Such valuations are likely a by-product of the “TINA” trade—own stocks because “There Is No Alternative” in a low-rate world. It worked famously when the bond market rallied for years on end.
What happens when the bond market goes the other direction?
Fixed income’s red ink may just be getting started. Even after about a half year of yields rising, the 10-Year U.S. Treasury yield has not yet flirted with 2%; it remains 43 basis points lower than the average inflation rate of the last three years.
Figure 2: 10-Year Treasury Yield Minus 3-Year Average U.S. Consumer Price Inflation (CPI)
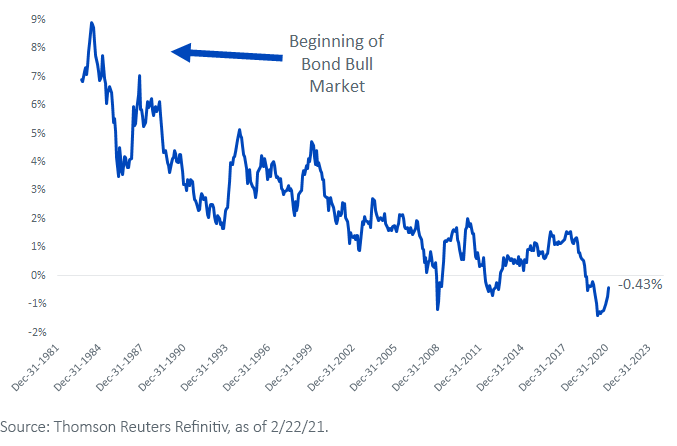
With Brent crude oil attacking $65 and U.S. home prices up 11% over the last year, to name just two inflation indicators, it may be wise to recall that the 10-Year t-note touched 3.24% as recently as November 2018.
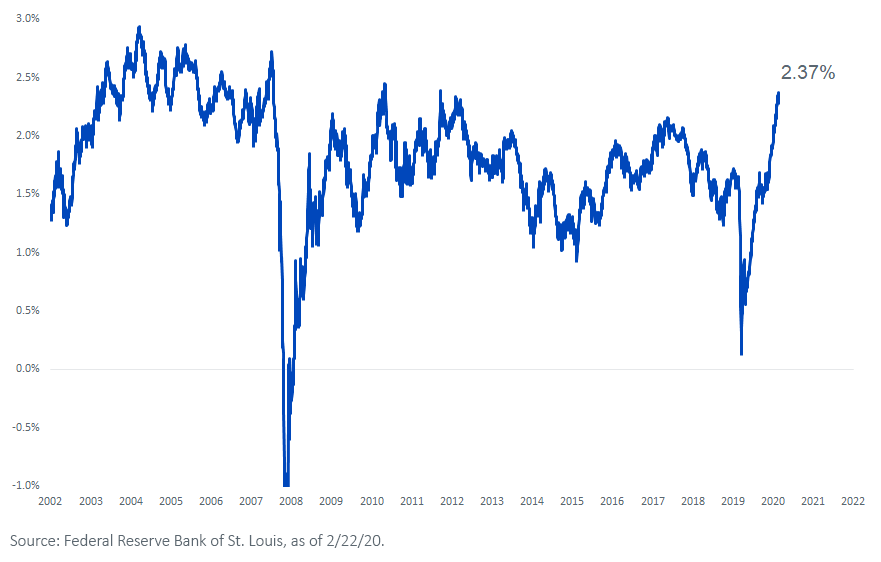
Take it closer to home, to expectations for inflation in the next few years. The bond market anticipates annual price increases of 2.37% between now and 2026 (figure 3).
Figure 3: U.S. Five-Year Breakeven Inflation Rate
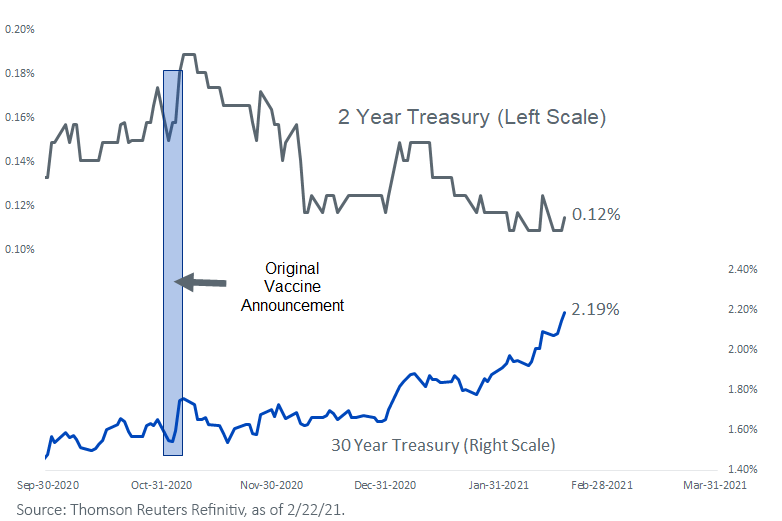
Meanwhile, in figure 4, the 30-Year Treasury bond appears to be doing one of two things:
1)Preparing for a repeat of the “Roaring ’20s,” or
2)Bracing for years of imbalanced budgets in Washington
In contrast, the 2-Year Treasury yield’s slow drift lower could be a pointing to a “Snoring ’20s.”
Figure 4: Near-Term Yields Declining, Long-Term Yields Rising
Quizzically, the Street expects the Federal Reserve (Fed) to hold off on rate hikes until the cows come home, yet the consensus also expects the labor market to be on fire, with just 4.6% unemployment in 2022. It’s hard to conceptualize how the Fed can continue to pin short rates at zero if jobs bounce back that strongly.
At the rate that commodities and house prices are surging, expectations for an accommodative Fed could get dashed. A newfound pivot to a rising rate regime—in both short and long rates—makes assets that promise distant cash flows look vulnerable, owing to the math behind present value calculations.
Stocks that trade for 10, 20, 30 times sales, many based on hopes and dreams of robust profits in 2025 or 2030 or beyond, may look appealing to some investors when Treasury rates are 0% or 1%—because future fortunes can be discounted at a tiny cost of capital.
But send interest rates up a point or two and the math changes.
If and when the five dozen or so companies in the S&P 500 with a price-to-sales ratio above 10 fall out of favor, it may be stocks with nearer-term cash flows that get the last laugh.
Categories
About the contributor

Head of Equity Strategy
Jeff Weniger, CFA, has been with WisdomTree since 2017 and serves as the Head of Equities. He shapes the firm’s market outlook through a combination of macroeconomic and fundamental analysis. With more than two decades in investment strategy, Jeff is known for his work on market cycles and valuations. Before joining WisdomTree, Jeff was with BMO Private Bank and BMO Global Asset Management for 11 years. At BMO, he sat on the firm’s Asset Allocation Committee and co-managed ETF model portfolios across the U.S. and Canada. In 2013, at age 32, he became the youngest member of BMO’s Global Investment Forum. When he left BMO to come to WisdomTree, his final role was Director, Senior Strategist in the Office of the CIO in 2017.
Jeff is a frequent television guest on networks such as CNBC, Bloomberg, and Schwab, with regular print appearances in The Wall Street Journal, Barron’s and Reuters. He also appears weekly on the Behind the Markets podcast and is a regular on SiriusXM’s The Business Briefing. On X, Jeff has developed one of the larger followings in financial media. He earned a B.S. in Finance from the University of Florida and an MBA from the University of Notre Dame. He has held the CFA charter since 2006.