

Is It Just a Matter of How Shallow or Deep?
Published July 20, 2022

Head of Investment and Fixed Income Strategy
While conjecturing on what type of rate hike would be implemented at next week’s July FOMC meeting was “all the rage” last week, concerns of a too aggressive rate increase regime remain front and center. Oh, and by the way, based upon Sunday’s article in the Wall Street Journal, it appears Powell & Co. are leaning toward a 75-basis-point (bp) hike, not the 100-bp move the markets were likely pricing in post-CPI last week. The markets don’t seem to be necessarily debating whether the U.S. economy will enter into a Fed-induced recession but rather just how shallow or deep any downturn may ultimately be.
I’ve written a couple of blog posts this year on the yield curve and its predictability for future recessions. Headlines were certainly “abuzz” on this front last week, as a widely followed measure of the Treasury (UST) yield curve (2s/10s) went inverted yet again. In this latest episode of negative spreads between the UST 2-Year and UST 10-Year yields, the level came out to roughly -20 bps, the widest inversion since late 2000.
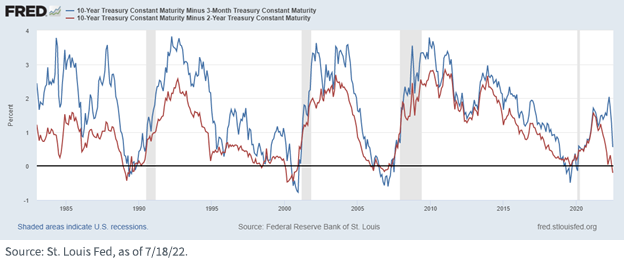
Needless to say, this development heightened concerns that a recession is on its way. However, another widely followed gauge, the UST 3mo/10yr yield curve, is still in positive territory. But there is no question that this differential has flattened considerably since I last blogged on this topic in early June. To provide some perspective, as of this writing, the 3mo/10yr spread had narrowed to under +60 bps versus a positive reading of around +175 bps about six weeks ago.
As I’ve mentioned previously, with the Fed’s aggressive use of quantitative easing (QE), one needs to take a deeper look at yield curves before drawing conclusions from the historical past. In my opinion, there is little doubt that Fed purchases of longer-dated Treasuries, combined with safe-haven buying, have played a “distorting” role on the back end of the curve and render a “fresh” look at yield curve analysis.
Perhaps the best way to think about it is that the yield curve may need to reveal a much more noteworthy inversion before signaling a recession could be on the way. For the record, in the case of the UST 3mo/10yr curve, the negative spread reached as wide as -60 bps and -77 bps before the two recessions that came before the most recent COVID-19-related downturn. That being said, as the graph highlights, going back to 1983, a recession did ensue when both of the yield curve measures mentioned here went into inverted territory, which is why recent developments in the UST 3mo/10yr spread caught my attention.
Conclusion
With the Fed poised to raise rates in an unprecedented manner next week (back-to-back 75-bp hikes) and potentially continue the process into the fall months, the odds of an inverted UST 3mo/10yr spread appear to have risen going forward. If the Fed Funds target range reaches a top of 3.50% by year-end (the level currently priced into the futures market), the 3-Month yield should closely follow suit. Simply doing the math, in order to avoid an inverted situation, the 10-Year yield would need to go back to the 3.50% threshold it tested in mid-June, or higher.
If history is any guide on the recession debate, the UST 3mo/10yr curve would seemingly not just move into inverted territory, but the negative reading would come in at a noticeable level as well. Stay tuned; this promises to be a fluid situation.
About the contributor

Head of Investment and Fixed Income Strategy
Kevin serves as the Head of Investment and Fixed Income Strategy. In this role, he writes macro and fixed income-related content and works closely with the sales, research and marketing teams. In addition, Kevin conducts client-facing webinars and meetings, providing expertise on WisdomTree’s existing and future bond ETFs. Prior to joining WisdomTree, Kevin spent 30 years at Morgan Stanley, where he was Managing Director and Chief Fixed Income Strategist for Wealth Management. He was responsible for tactical and strategic recommendations and created asset allocation models for fixed income securities. He was a contributor to the Morgan Stanley Wealth Management Global Investment Committee, primary author of Morgan Stanley Wealth Management’s monthly and weekly fixed income publications, and collaborated with the firm’s Research and Consulting Group Divisions to build ETF and fund manager asset allocation models. Kevin has an MBA from Pace University’s Lubin Graduate School of Business, and a B.S. in Finance from Fairfield University.