

If We See Stock Market Mean Reversion, Heads Will Spin
Published December 6, 2023

Head of Equity Strategy
When you do this for a while, there are years that really stick in your head when it comes to the notable and quotable dates of stock market lore. The years 1999 and 2000 are among them, for reasons of the end of the dot-com bubble. Keep those two specific years in mind as we look at four charts.
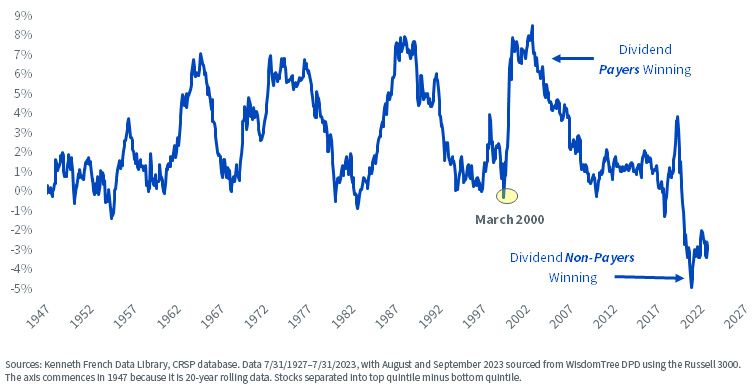
Right now, the stock market is blowing out the 20 years from 1980 to 2000 on a specific performance metric. The last two decades have witnessed firms with a 0% dividend yield outperforming the highest yielders by a larger amount than at any time in pre-Covid history, including that one. In figure 1, see the boldness with which the snapbacks hit.
Figure 1: 20-Year Rolling Annualized Outperformance, Top Quintile of Stocks by Dividend Yield minus Stocks Paying No Dividends
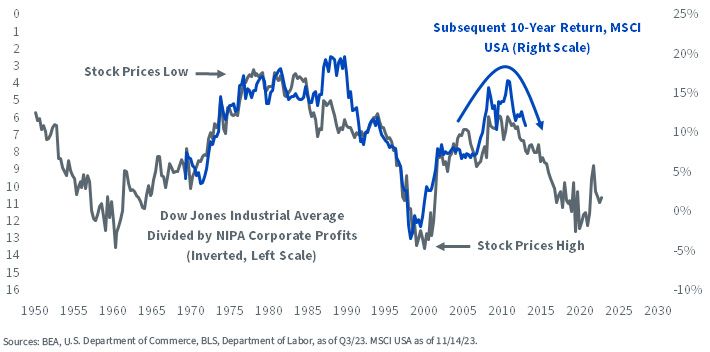
In figure 2, I divided the Dow Industrials by NIPA corporate profits. Because the market bolted so boldly from the 2009 lows until the height of the mania in 2021, the relationship is near historic extremes. If the chart’s fit is any guide, maybe the coming years witness a market that frustrates the bulls.
Figure 2: Dow Industrials Relative to NIPA Corporate Profits
Another situation that may just mean revert is the relationship between stock and bond returns. If the consensus has it right, that the Fed is done tightening for this cycle, take heed of the message from figure 3. Maybe the hated bond market is ready to start outperforming.
Figure 3: The End of Tightening Cycles Tends to Favor Long-Term Bonds over Stocks
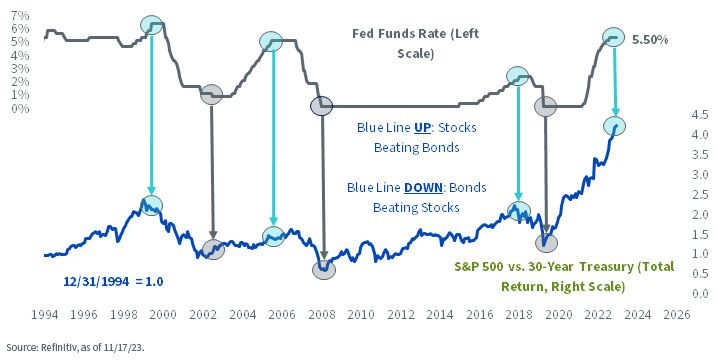
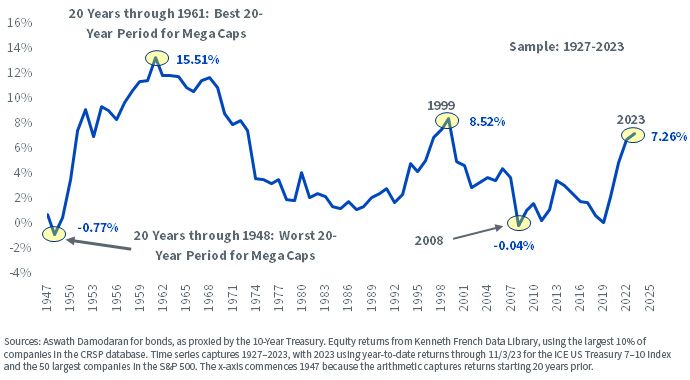
Figure 4 helps that argument. We are at a 20-year extreme in equity outperformance over bonds. Like the chart of dividend payers versus non-payers, the pre-Covid precedent for such things takes place in about the eighth inning of the dot-com bubble: 1999.
Figure 4: 20-Year Annualized Performance Differential, Mega-Caps vs. Bonds
Let’s summarize our four charts:
1.Companies that paid no dividend just had the greatest 20-year bout of outperformance over the biggest dividend payers on record.
2.The Dow relative to NIPA corporate profits points to 2023–2033 being a tough market for stocks.
3.The end of the Fed’s tightening cycles points to bonds beating stocks.
4.2003–2023 witnessed stocks beating bonds by an order of magnitude that is only matched by the 20 years after the Second World War and by 1979–1999.
We see a lot of portfolios land on our desk. Top-heavy in tech, Magnificent Seven all over the place, huge overweights in U.S. equities, general disdain for fixed income, little or nothing in the way of deep value and on it goes. If any or all of these charts revert to the mean, heads will spin.
Categories
About the contributor

Head of Equity Strategy
Jeff Weniger, CFA, has been with WisdomTree since 2017 and serves as the Head of Equities. He shapes the firm’s market outlook through a combination of macroeconomic and fundamental analysis. With more than two decades in investment strategy, Jeff is known for his work on market cycles and valuations. Before joining WisdomTree, Jeff was with BMO Private Bank and BMO Global Asset Management for 11 years. At BMO, he sat on the firm’s Asset Allocation Committee and co-managed ETF model portfolios across the U.S. and Canada. In 2013, at age 32, he became the youngest member of BMO’s Global Investment Forum. When he left BMO to come to WisdomTree, his final role was Director, Senior Strategist in the Office of the CIO in 2017.
Jeff is a frequent television guest on networks such as CNBC, Bloomberg, and Schwab, with regular print appearances in The Wall Street Journal, Barron’s and Reuters. He also appears weekly on the Behind the Markets podcast and is a regular on SiriusXM’s The Business Briefing. On X, Jeff has developed one of the larger followings in financial media. He earned a B.S. in Finance from the University of Florida and an MBA from the University of Notre Dame. He has held the CFA charter since 2006.