

Falling Market Prices but Growing Dividends
Published November 7, 2022

Director, Research
This year has reminded—or taught—investors about equity risk premium.
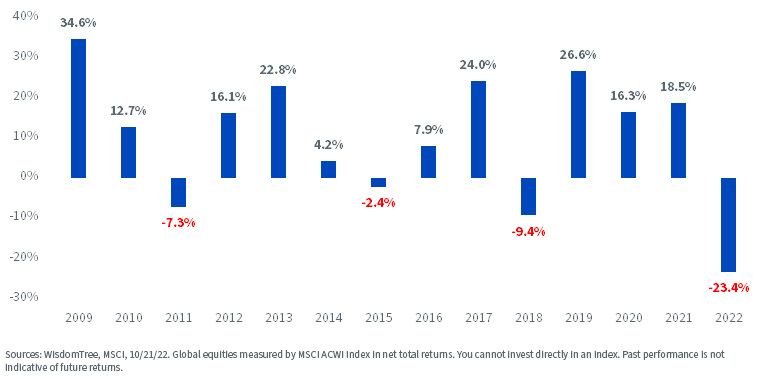
In the previous 13 years, global stocks ended down just three times. All declines were less than 10%.
Global Equities Calendar Year Returns
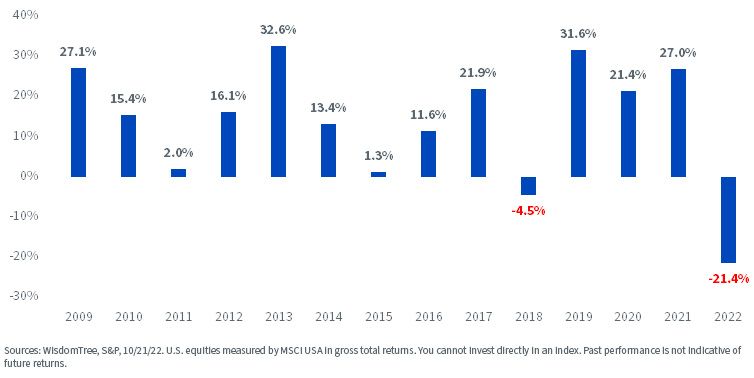
U.S.-centric investors have been accustomed to even fewer declines. Equities had only one negative return of less than 5% during the same period.
That 1 in 13 hit rate (8%) is far less than the 18 out of 64 years of negative declines (28% of the time) since the launch of the S&P 500 in 1957.
U.S. Equities Calendar Year Returns
There has been no shortage of forces weighing on equity returns this year, including:
- Slowing and/or negative economic growth
- High and rising inflation
- Tightening monetary policy
But dividend growth—and rising dividend yields—may be a silver lining for investors.
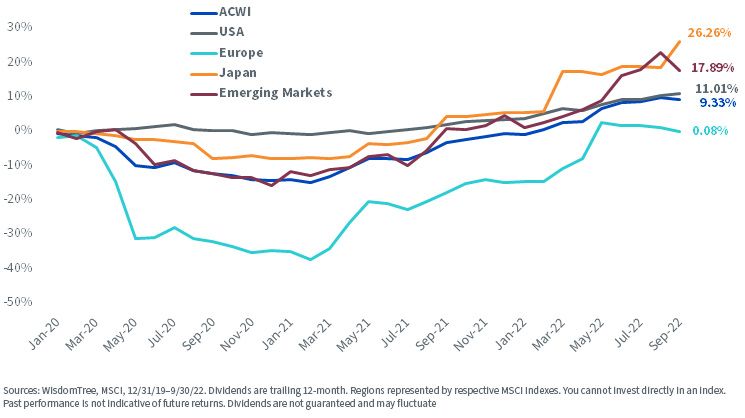
As earnings have continued to trend positively, dividend payouts—which tend to be far less volatile than stock prices—have shown continued growth.
Dividend Growth by Region Since December 2019
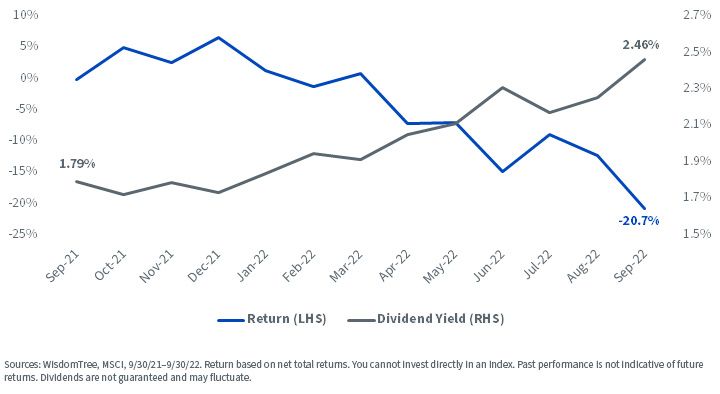
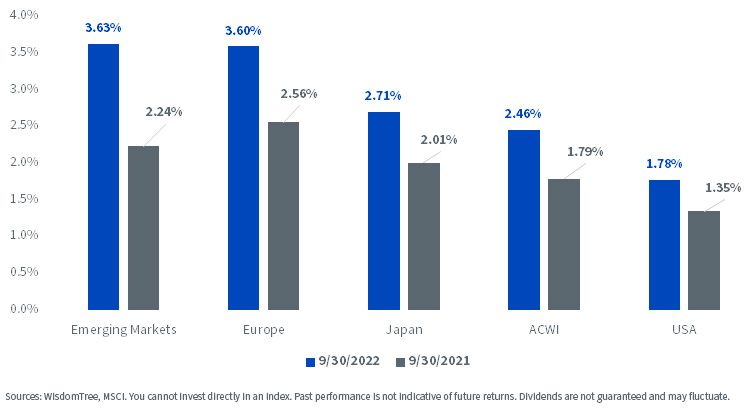
As dividends have grown and asset prices have tumbled, dividend yields have steadily crept higher. From September 30, 2021, the dividend yield on the MSCI ACWI Index has increased from 1.79% to 2.46%.
MSCI ACWI Index
Across markets, we have seen the biggest increases in yield from Emerging Markets—an increase of 1.39% from 2.24% to 3.63%.
MSCI Index Dividend Yields
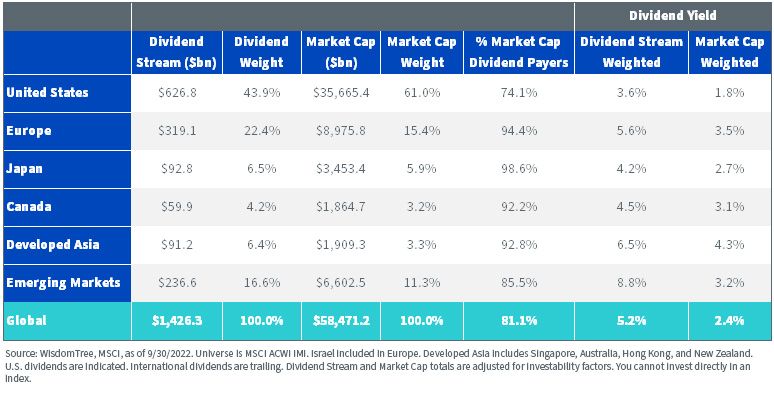
In aggregate, global equities have a Dividend Stream® of $1.4 trillion. Forty-four percent of dividends come from the U.S., far less than its 61% share of the global market cap.
If we look at Dividend Stream-weighted versions of U.S. equities, we see a yield of 3.6%—twice as high as the 1.8% yield on the market cap-weighted Index.
For global equities, the market cap-weighted yield is 2.4% compared to a 5.2% Dividend Stream-weighted yield.
Global Dividend Stream Summary
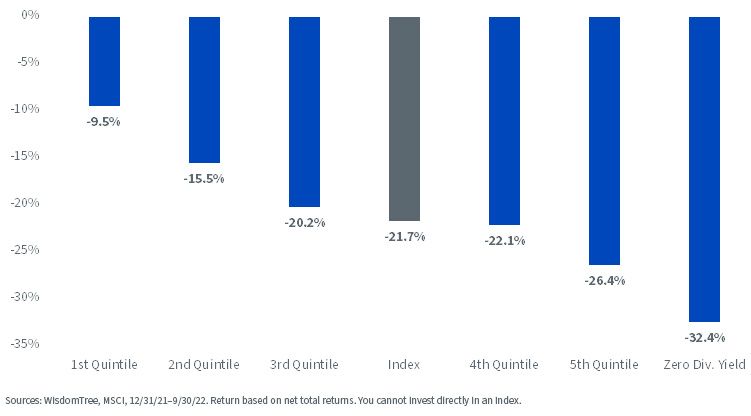
Amid the market volatility, the high-dividend segments of the ACWI Index—the first through third quintiles in the below chart—have outperformed.
The non-dividend segment of the market has had the worst performance, down more than 30%.
MSCI ACWI Index Dividend Yield Quintiles
WisdomTree Global Dividend Index
At the market close on October 20, the WisdomTree Global Dividend Index (WTGDIV) underwent its annual reconstitution.
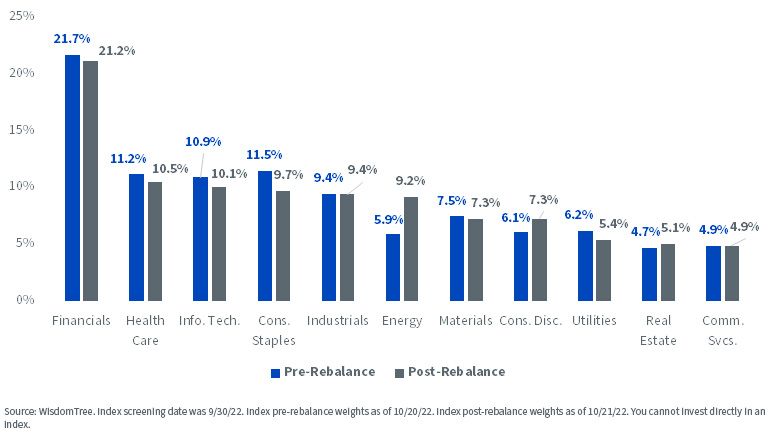
The fundamentals-based rebalancing process generally results in a weight increase to companies increasing their payouts and less weight to companies with decreased payouts.
From a sector perspective, the biggest change was an increase in weight of more than 3% to the Energy sector.
WisdomTree Global Dividend Index Sector Weights
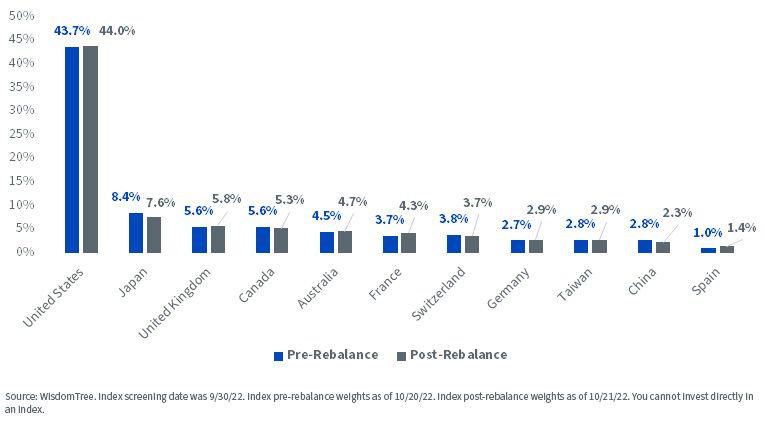
From a country perspective, there were similarly modest changes. The United States remains at 44%, the largest weight, ahead of the 8% exposure for Japan. Those weights compare to a 61% weight for the U.S. and a 6% weight for Japan in the market cap-weighted MSCI ACWI Index.
WisdomTree Global Dividend Index Country Weights
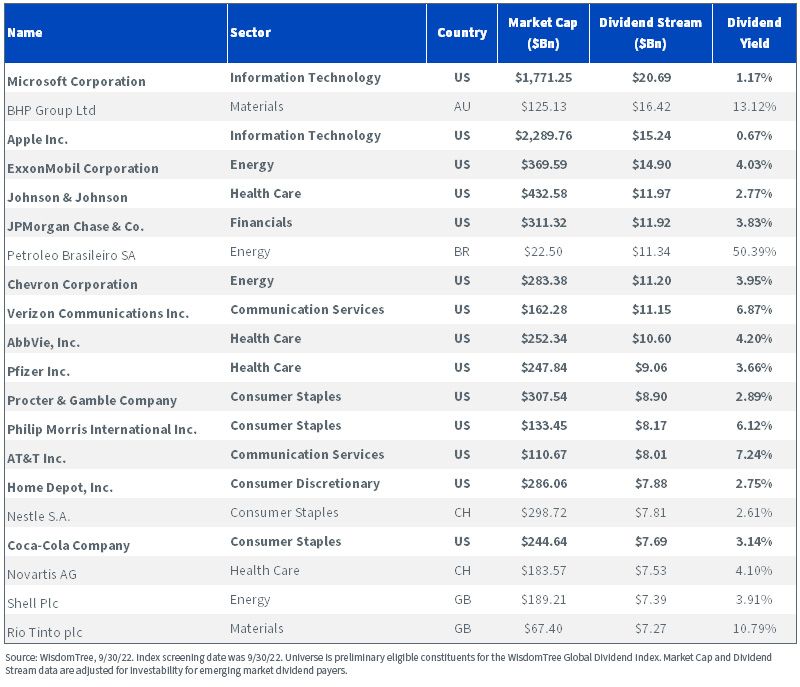
The largest dividend payer as of the screening date was Microsoft, with a nearly $21 billion Dividend Stream.
With the boom in commodities prices, we see Materials companies BHP and Rio Tinto also in this top 20 list.
Top 20 Global Dividend Payers
Saudi Arabia Inclusion
Saudi Arabia was added as an eligible country at this year’s rebalance.
Saudi Arabia was added to the MSCI Emerging Markets Index in 2019 and has since grown to a roughly 5% weight of that Index. Given its growing market cap and the increased market access for investors, we felt now was a good time to add the country to our universe.
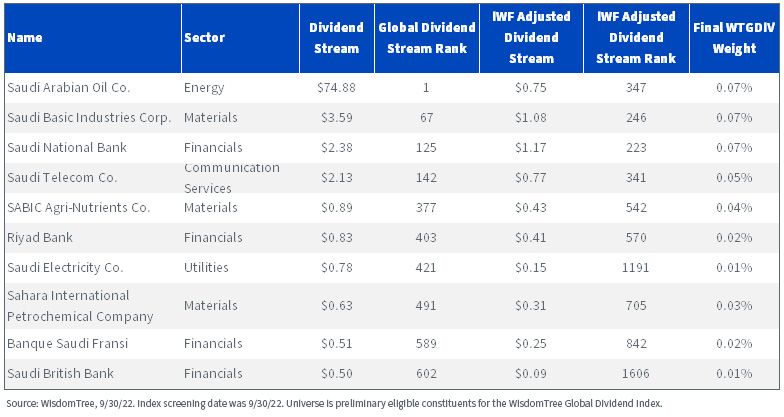
Saudi Arabian Oil Co. (Saudi Aramco) is the world’s largest cash dividend payer at nearly $75 billion. Given that much of its shares are closely held by insiders and/or the Saudi government, just 1% of its market cap weight is included in market cap-weighted indexes.
WisdomTree’s dividend Indexes make a similar adjustment for emerging market dividend payouts. After making this adjustment, Saudi Aramco is just the 347th largest dividend payer in our Global Dividend Index starting universe.
In aggregate, Saudi Arabia has about a 0.5% weight in the WisdomTree Global Dividend Index (WTGDIV), which is roughly in line with its weight in the MSCI ACWI Index.
Top 10 Saudi Arabia Dividend Payers
Categories
About the contributor

Director, Research
Matt Wagner joined WisdomTree in May 2017 as an Analyst on the Research team. He currently serves as a Director, where he supports the creation, maintenance, and reconstitution of WisdomTree’s indexes and actively managed ETFs. Matt began his career at Morgan Stanley, working as an analyst in Treasury Capital Markets from 2015 to 2017, focusing on unsecured funding planning, execution, and risk management. He graduated magna cum laude from Boston College in 2015 with a B.A. in International Studies, concentrating in Economics. In 2020, he earned a Certificate in Advanced Valuation from NYU Stern. He is also a Chartered Financial Analyst (CFA) charterholder.