

“Curve”ology 101
Published May 21, 2019

Head of Investment and Fixed Income Strategy
Yes, it’s time for your final in “Curve”ology 101. While you probably thought all exams were over, alas, your finance professor said, “Not so fast.”
The U.S. Treasury (UST) yield curve has received a great deal of attention ever since the first inverted construct appeared late last year. Indeed, this negative spread relationship between the 2-Year and 5-Year notes was heralded as a potential sign that there was not only a visible slowdown in the economy was looming but perhaps an outright recession on the horizon. I certainly have a great deal of respect for history, and history has taught us that in the past, more often than not, an inversion between these two Treasury maturities was a harbinger for an economic downturn.
U.S. Treasury 3-Mo/10-Yr Spread
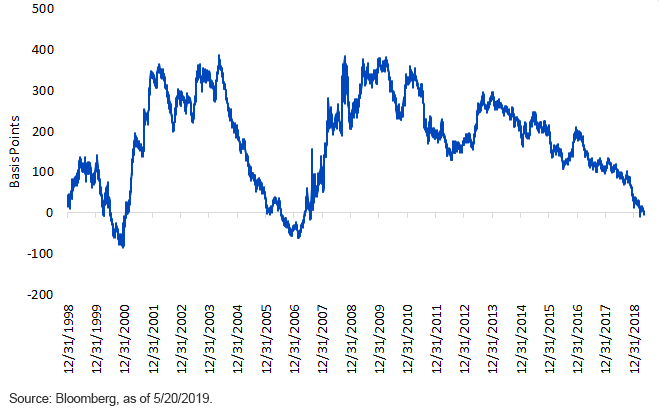
The decibel level surrounding potential economic weakness only got louder when the UST 3-Month/10-Year curve fell into negative territory back in March. In fact, this inverted construct represented the first negative spread relationship between the two maturities since 2007, and we all know what happened after that…a financial crisis and the Great Recession. While a repeat of that infamous period in economic and financial history was not being projected, the “growth doomsayers” were ratcheting up their rhetoric.
Once again, make no mistake…if we don’t learn from history, we are doomed to repeat it. But sometimes cooler heads do prevail. Let’s take a closer look at this UST 3-Month/10-Year inversion. Up until a brief negative print last week, this spread was in the minus column for a total of only five days in March, with the peak inversion being almost -7 basis points (bps). Take a look at the graph above. This highlights the UST 3-Month/10-Year curve over the last 20 years. The aforementioned prior period of inversion lasted roughly from July 2006 through May 2007 (10 months), with a peak negative level of -62 bps. Before that, one has to go back to the seven months between July 2000 and January 2001, which registered a reading of -82 bps at its height.
Conclusion
What I’m trying to point out is that the current inverted status does not live up to prior historical events. Now, that’s not to say developments couldn’t change, but as of this writing, I don’t believe the current UST 3-Month/10-Year curve is a harbinger for a recession. One last point: the UST 2-Year/10-Year curve is still in positive territory.
Unless otherwise stated, data source is Bloomberg, as of 5/20/2019.
Categories
About the contributor

Head of Investment and Fixed Income Strategy
Kevin serves as the Head of Investment and Fixed Income Strategy. In this role, he writes macro and fixed income-related content and works closely with the sales, research and marketing teams. In addition, Kevin conducts client-facing webinars and meetings, providing expertise on WisdomTree’s existing and future bond ETFs. Prior to joining WisdomTree, Kevin spent 30 years at Morgan Stanley, where he was Managing Director and Chief Fixed Income Strategist for Wealth Management. He was responsible for tactical and strategic recommendations and created asset allocation models for fixed income securities. He was a contributor to the Morgan Stanley Wealth Management Global Investment Committee, primary author of Morgan Stanley Wealth Management’s monthly and weekly fixed income publications, and collaborated with the firm’s Research and Consulting Group Divisions to build ETF and fund manager asset allocation models. Kevin has an MBA from Pace University’s Lubin Graduate School of Business, and a B.S. in Finance from Fairfield University.