

A Surprisingly Low-Vol Asset Class
Published May 21, 2021

Global Chief Investment Officer

Director, Research
Relative valuation discounts typically reflect higher volatility, slower earnings growth and/or less predictable earnings.
When investors think of foreign small-cap equities, they often intuitively expect discounted valuations relative to U.S. large caps, to compensate for higher volatility. While we are seeing discounted valuations in foreign small caps, these discounts are not necessarily driven by higher volatility.
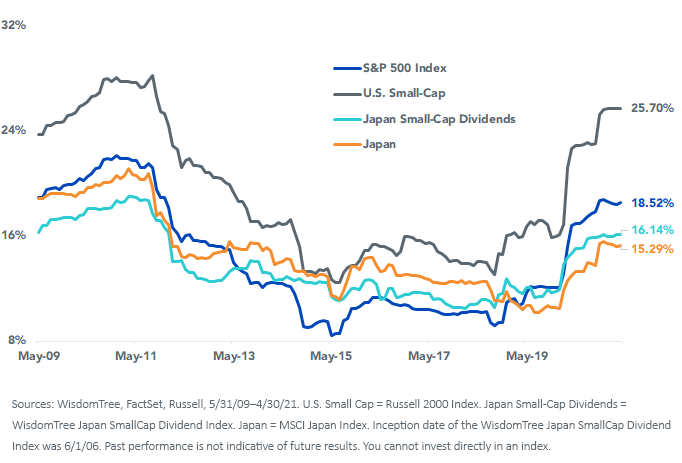
Looking at rolling three-year standard deviations, the Russell 2000 Index clearly has higher volatility than the S&P 500 Index. But Japanese small caps generally have been lower vol than U.S. large caps for much of the last decade and considerably lower vol than U.S. small caps.
Relative to Japanese large caps—an important comparison as both indexes are measured in U.S. dollars and the risk-off nature of the yen dampens volatility relative to local currency returns—small caps had only modestly higher volatility in the most recent period, but they have had lower volatility over most of this time frame.
Rolling 36-Month Standard Deviation
Are Japanese Small Caps Good Diversifiers?
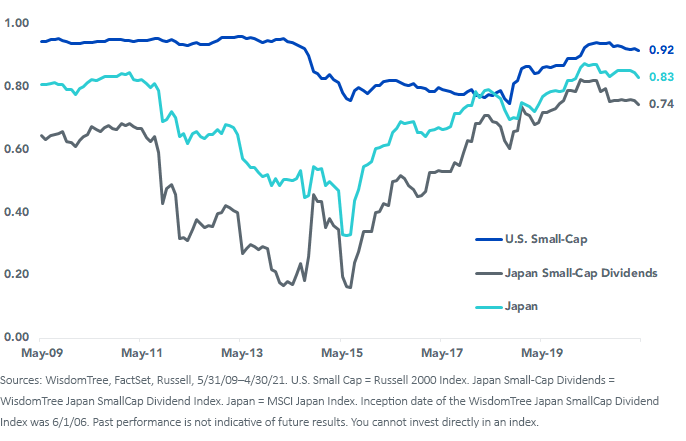
The Russell 2000 consistently prints correlations to the S&P 500 above 0.9. The Japanese small cap market is one of least correlated to the S&P 500, even though it has risen from as low as a 0.16 correlation.
Rolling 36-Month Correlation (to S&P 500 Index)
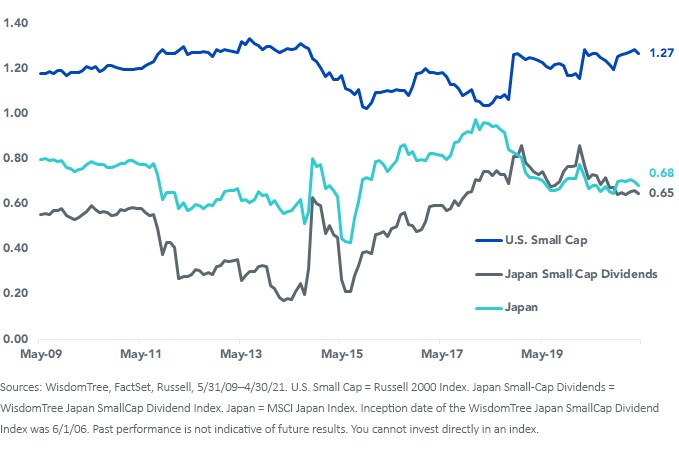
The lower correlation and lower volatility yield a beta to the S&P 500 that consistently has been roughly half that of the U.S. small-cap market. If looking for market exposure with less S&P 500 beta, Japan small caps represent that.
Rolling 36-Month Beta (to S&P 500 Index)
What Contributes to the Lower Vol?
For one: dividend payers.
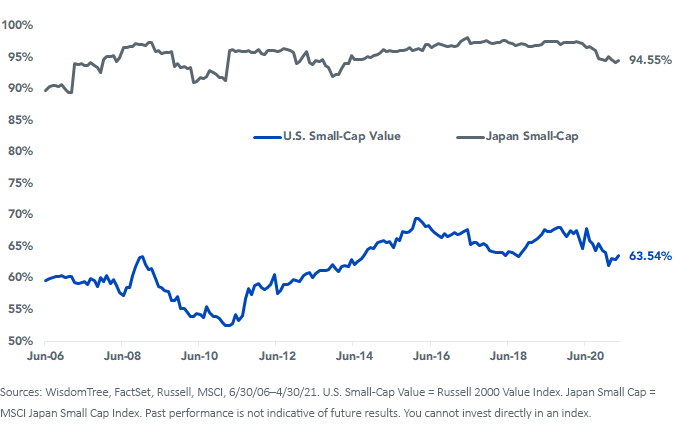
In the U.S., we don’t think of small caps as dividend payers—the Russell 2000 Value Index has less than two-thirds of its index weight in dividend payers. In Japan, 95% of the weight of small caps is dividend payers.
What is more, their dividends were more stable during the COVID-19 pandemic than U.S. small caps that were slashing dividend payouts. This was partly because Japanese companies have more cash on their balance sheets and more conservative payouts to cushion dividends from cuts.
Percent Index Weight in Dividend Payers
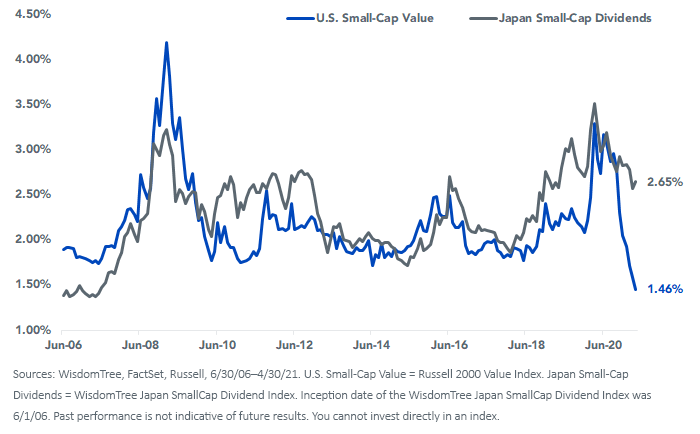
If you go back a decade, the average dividend yield of U.S. small-cap value stocks was higher than that of Japanese small caps. No longer—and the gap has widened considerably with strong dividend growth in Japan.
Dividend Yield
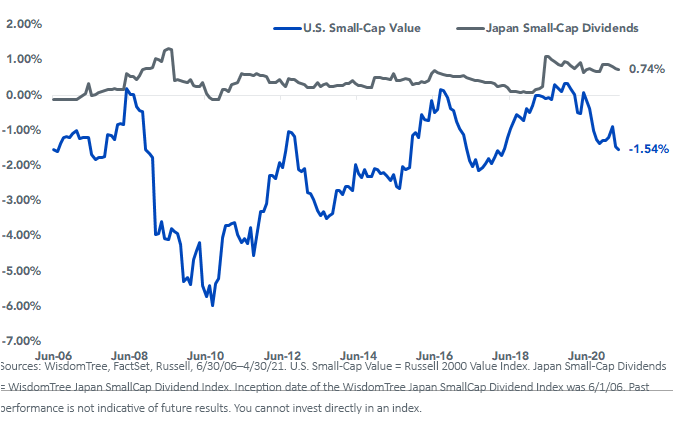
Another factor that contributes to lower volatility is net share buybacks. The net buyback yield for U.S. small-cap value stocks has been consistently negative, and increasingly so in recent years. This means these companies are net share issuers, diluting existing shareholders.
Japanese small caps on the other hand are net share purchasers, in addition to having higher dividend yields. Share buybacks can dampen volatility by providing a source of demand to offset selling when uncertainty picks up.
Net Buyback Yield
While higher dividends and share buybacks may be contributing to dampened volatility for Japanese equities, the price-to-earnings ratio gap is also widening between the two markets—partly driven by more money-losing companies in the U.S. value segment.
Est Price to Earnings
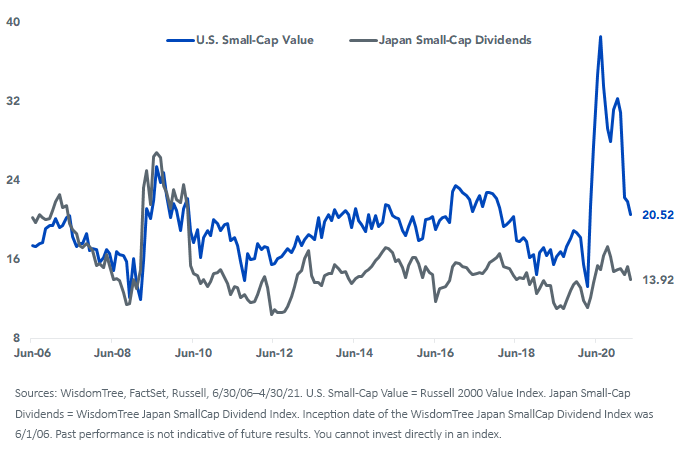
The Japanese domestic economy is one of the most sensitive economies to global economic prospects. This has the negative consequence of choppy economic growth for the Japanese economy and has hampered valuation expansion in the country’s equities.
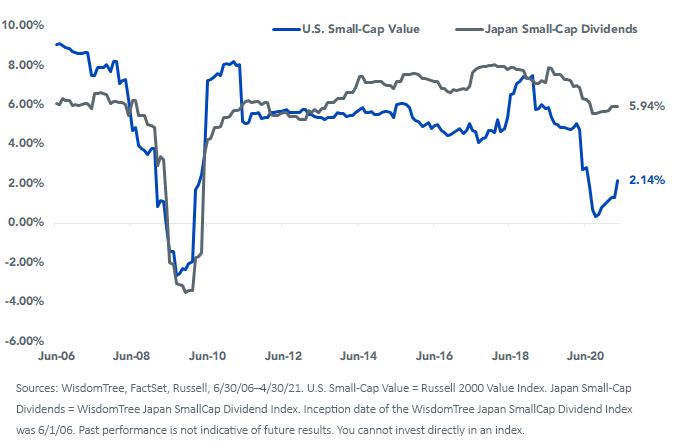
With that said, corporate profitability has improved significantly since 2012, and has been substantially higher than for U.S. small caps.
Return on Equity
Conclusion
As a market with surprisingly low volatility, depressed relative valuations to even the best value U.S. small caps and high relative profitability, Japanese small caps may deserve consideration by value-starved asset allocators.
Categories
About the contributors

Global Chief Investment Officer
Jeremy Schwartz has served as Global Chief Investment Officer since November 2021 and leads WisdomTree’s investment strategy team in the construction of WisdomTree’s equity Indexes, quantitative active strategies and multi-asset Model Portfolios. Jeremy joined WisdomTree in May 2005 as a Senior Analyst, adding Deputy Director of Research to his responsibilities in February 2007. He served as Director of Research from October 2008 to October 2018 and as Global Head of Research from November 2018 to November 2021. Before joining WisdomTree, he was a head research assistant for Professor Jeremy Siegel and, in 2022, became his co-author on the sixth edition of the book Stocks for the Long Run. Jeremy is also co-author of the Financial Analysts Journal paper “What Happened to the Original Stocks in the S&P 500?” He received his B.S. in economics from The Wharton School of the University of Pennsylvania and hosts the Behind the Markets podcast. Jeremy is a member of the CFA Society of Philadelphia.

Director, Research
Matt Wagner joined WisdomTree in May 2017 as an Analyst on the Research team. He currently serves as a Director, where he supports the creation, maintenance, and reconstitution of WisdomTree’s indexes and actively managed ETFs. Matt began his career at Morgan Stanley, working as an analyst in Treasury Capital Markets from 2015 to 2017, focusing on unsecured funding planning, execution, and risk management. He graduated magna cum laude from Boston College in 2015 with a B.A. in International Studies, concentrating in Economics. In 2020, he earned a Certificate in Advanced Valuation from NYU Stern. He is also a Chartered Financial Analyst (CFA) charterholder.