

50 Shades of Value: Smaller
Published December 3, 2018

Head of Indexes, U.S.
In Part I of this blog series, we wrote that there are many ways of accessing value, and investors should be aware of those definitions because they will impact a strategy’s exposures and returns.
We showed how the earnings-weighted methodology of the WisdomTree U.S. Earnings 500 Index (WTEPS) implicitly tilts toward the value factor and results in characteristics that have contributed positively to performance over the last decade. In this post, we’ll show how the definition of value matters just as much when going down the market cap (size) spectrum.
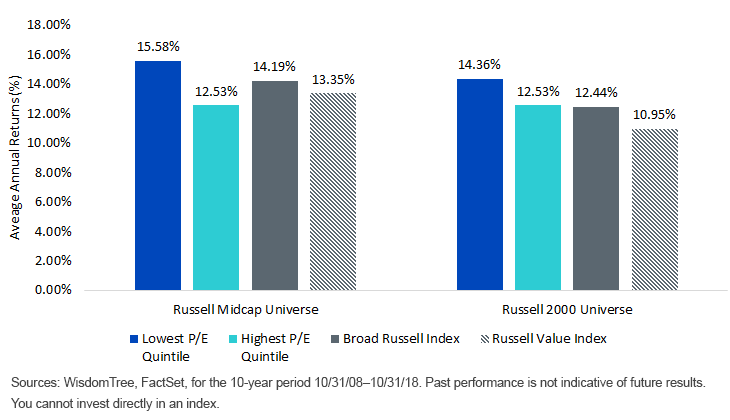
Below, we can see that over the last 10 years, the least-expensive companies as measured by the price-to-earnings (P/E) ratio have outperformed their respective broad Russell Midcap and Russell 2000 indexes. The magnitude of this outperformance in the mid- and small-cap universe is significantly greater than in the large-cap universe because factor exposures are magnified in less-efficient markets. During this period, there has also been a positive spread in the performance of the lowest P/E quintile (undervalued constituents) and highest P/E quintile (overvalued constituents). However, we can see that the value versions of these Russell indexes, which are built by over-weighting companies with low price-to-book value (P/B) ratios, have lagged the broad indexes over the same period.
The definition of value matters, and low P/B has lagged low P/E over the last 10 years.
Trailing 10-Year Returns: Russell MidCap and 2000 Indexes
Low P/E Outperformed But Value Indexes Lagged?
WisdomTree U.S. Earnings Family
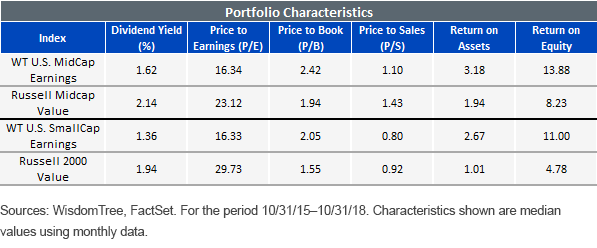
Since their inception in January 2007, the WisdomTree U.S. MidCap Earnings Index (WTMEI) and the WisdomTree SmallCap Earnings Index (WTSEI) have outperformed 98% and 92%, respectively, of their peers in their Morningstar Categories while tilting to the value factor. These Indexes are rebalanced annually by weighting constituents with positive trailing 12-month core earnings in their respective universe by their proportionate share of total aggregate earnings. Their methodology results in a lower aggregate valuation as measured by their P/E, higher profitability and stronger characteristics than their Russell value benchmarks, whose methodology over-weights low P/B stocks. It is this combination of factor exposures, value and quality, that has led WTMEI and WTSEI to outperform their broad and value Russell benchmarks.
Mid-Caps
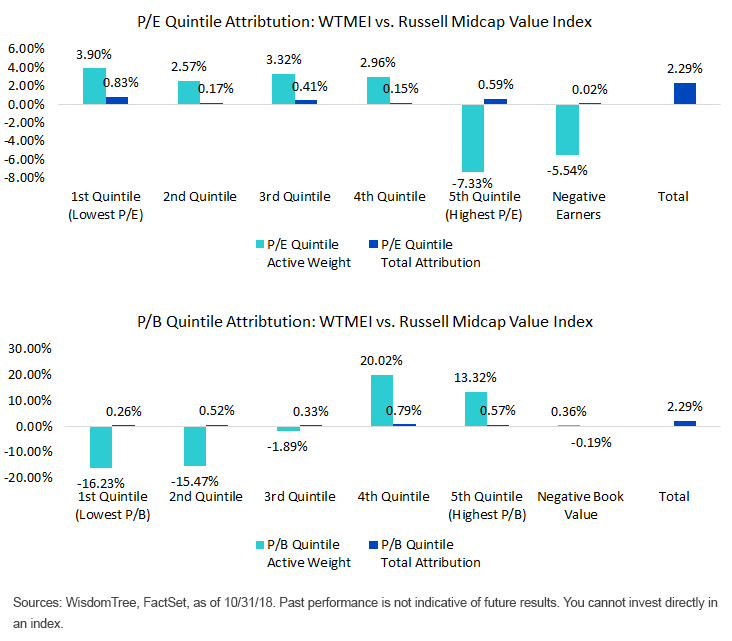
Since its inception almost 12 years ago, WTMEI has outperformed the Russell Midcap Value Index by 2.29% annually. Below, we highlight how the methodology of WisdomTree’s Index is responsible for the stronger performance by showing performance attribution on P/E and P/B quintiles. The teal bar shows whether WTMEI is over- or under-weight in a given quintile group, while the blue bar shows the contribution to alpha stemming from the given quintile group. As expected, WTMEI is over-weight in the lowest P/E quintiles and significantly under-weight in the highest P/E quintile and the group of negative earners. These allocations have been the main contributors to alpha, shown in the blue bars. In the second chart, we can see that the difference in methodology between WTMEI and the Russell Midcap Value Index results in significant active weight deviations from a P/B perspective. These deviations, under-weight lowest P/B, have been contributors to alpha as the two lowest P/B quintiles have trailed the market since January of 2007.
P/E Quintile Attribution: WTMEI vs. Russell Midcap Value Index
Small Caps
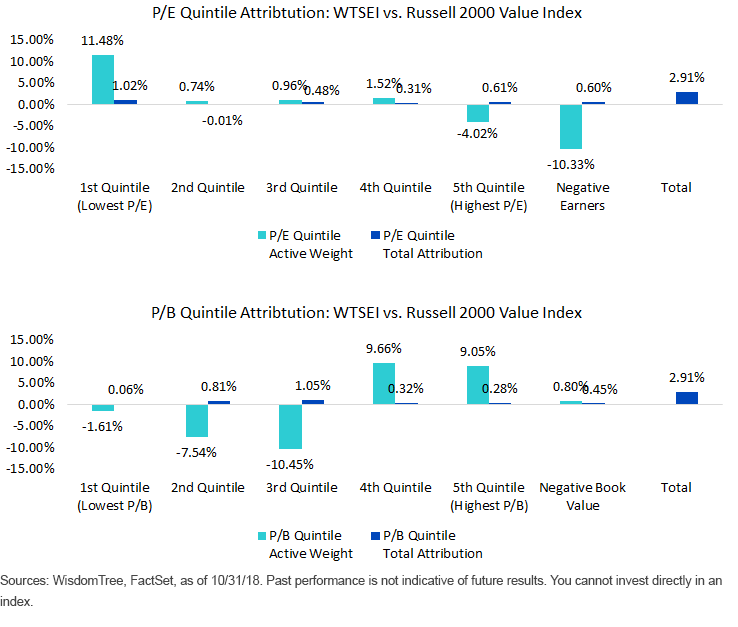
WTSEI has narrative similar to WTMEI’s, and the benefits of its methodology are very noticeable. Since its inception in January 2007, WTSEI outperformed the Russell 2000 Value Index by 2.91% annually. From a P/E perspective, we can see that WTSEI is significantly over-weight in the lowest P/E quintile, which has beaten the broad market, thus contributing close to one-third of the alpha. At the same time, WTSEI has been significantly under-weight in the overvalued or highest P/E quintile and companies with negative earnings, which has further contributed to alpha. Similarly, through a P/B lens, we can see how the alpha is evenly distributed among the quintiles.
P/E Quintile Attribution: WTSEI vs. Russell 2000 Value Index
It is academically-accepted that factor exposures are magnified when going down the market cap spectrum because inefficiencies tend to persist. Therefore, it is important for investors to know how factors are defined and what type of factor exposures result from their investment decisions. It is especially important to know what shade of value you’re getting when going smaller.
Categories
About the contributor

Head of Indexes, U.S.
Alejandro Saltiel joined WisdomTree in May 2017 as part of the Quantitative Research team. Alejandro oversees the firm’s Equity indexes and actively managed ETFs. He is also involved in the design and analysis of new and existing strategies. Alejandro leads the quantitative analysis efforts across equities and alternatives and contributes to the firm’s website tools and model portfolio infrastructure. Prior to joining WisdomTree, Alejandro worked at HSBC Asset Management’s Mexico City office as Portfolio Manager for multi-asset mutual funds. Alejandro received his Master’s in Financial Engineering degree from Columbia University in 2017 and a Bachelor’s in Engineering degree from the Instituto Tecnológico Autónomo de México (ITAM) in 2010. He is a holder of the Chartered Financial Analyst designation.