

1H 2020: Factors in Review
Published July 9, 2020

Director, Research
We just passed the halfway point in a year that already feels like an eternity. It’s time to review the scorecard of factor performance.
On June 8, the National Bureau of Economic Research made the official announcement that the U.S. had entered a recession at the end of February. This ended a record 128-month expansion that began in June 2009.
Quality stocks tend to be among the best performers during this stage of the economic cycle. These companies are often characterized by cleaner balance sheets and/or higher profitability—attractive attributes during a fragile economy.
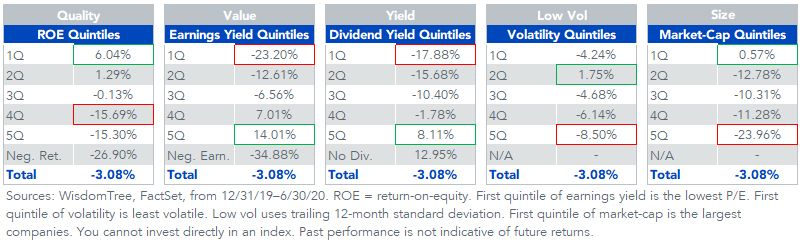
Through the first six months of the year, higher-quality stocks did indeed outperform. The first quintile by profitability (return-on-equity) outperformed the fifth quintile by 21.34%.
Value stocks, which tend to perform inversely to quality, have significantly lagged. The lowest price-to-earnings (P/E) quintile trailed the highest P/E quintile by 37%.
S&P 500 Index Quintile Performance
Market Efficiency: Greater Safety, Higher Valuations
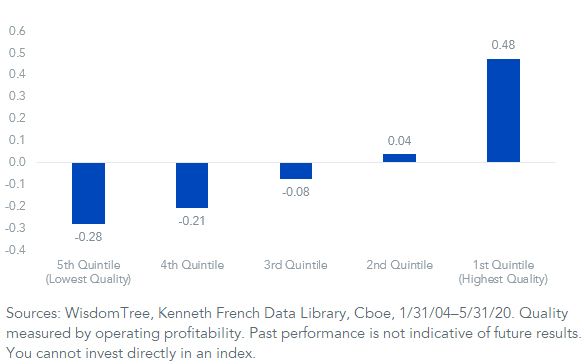
When volatilityincreases, we can see a positive relationship with the outperformance of higher-quality stocks, and underperformance for lower quality.
Correlation of 12-M Trailing Change in VIX and 12-M Trailing Excess Returns of Quality Quintiles
Market efficiency would suggest that the tendency of higher-quality companies to provide risk mitigation means there should be a valuation premium for these stocks.
And this is exactly what we see, historically.
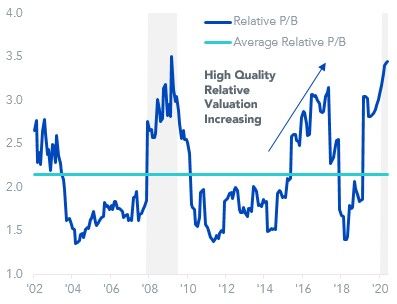
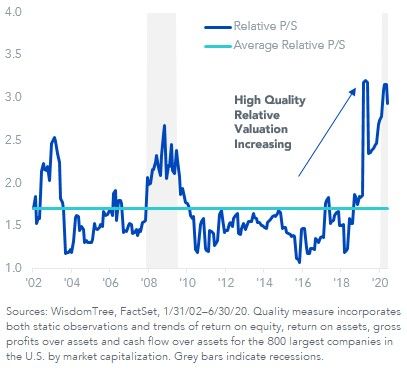
Since 2002, the highest-quality stocks have had an average price-to-book (P/B) premium of over 2 times the P/B ratio of the lowest quality stocks. On price-to-sales (P/S), this premium has been about 1.7 times for the highest quality stocks.
Based on current P/B ratios, high-quality stocks are priced at a valuation extreme—matched only by levels seen during the last recession in March 2009. Valuations based on P/S show an even more dramatic valuation extreme for high quality.
Relative Price-to-Book: Highest Quality vs. Lowest Quality Quartiles
Relative Price-to-Sales: Highest Quality vs. Lowest Quality Quartiles
The cost of this safety premium is likely to be realized during an economic recovery phase. When investors are more optimistic about the economy, richly priced quality stocks are likely to lag stocks with lower multiples that may be perceived as riskier.
Quality Selection + Dividend Weighting = Attractive Relative Valuation
This trade-off, of valuation premium for safety, seems like a fair bargain, particularly for investors with a shorter time horizon.
But there is perhaps a way that investors can have their cake (higher-quality companies) and eat it too (controlling for valuations).
The WisdomTree U.S. Quality Dividend Growth Index selects 300 high-quality companies, and then weights constituents by their dividends paid. This fundamentals-based weighting helps to mitigate valuations risks that can occur in market cap-weighted indexes.
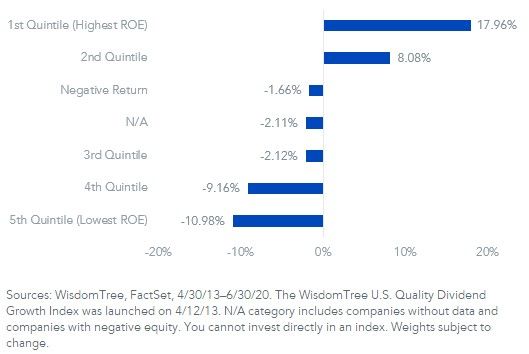
Over the full history back to 2013, the Index has had almost 18% greater weight in the highest-ROE quintile of companies, and an under-weight of about 11% to the lowest-ROE quintile.
Average Relative Quintile Weights: WisdomTree U.S. Quality Dividend Growth vs. S&P 500
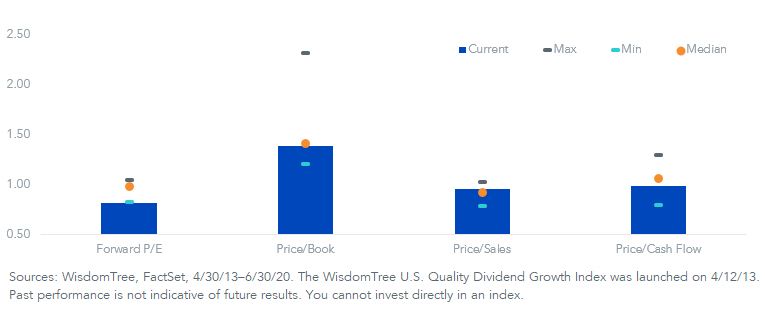
As a result of the dividend weighting process, we see relative valuations for the quality dividend growth index that are at the historical median for price-to-book, price-to-sales and price-to-cash flow. Based on forward P/E, the quality Index is at an all-time low relative to the S&P 500, which is currently at a 10-year high forward P/E of 22.36 times.
In our view, these relative valuations for a high-quality basket look attractively priced, particularly for this stage of the cycle.
WisdomTree U.S. Quality Dividend Growth vs. S&P 500 – Relative Valuations
Categories
About the contributor

Director, Research
Matt Wagner joined WisdomTree in May 2017 as an Analyst on the Research team. He currently serves as a Director, where he supports the creation, maintenance, and reconstitution of WisdomTree’s indexes and actively managed ETFs. Matt began his career at Morgan Stanley, working as an analyst in Treasury Capital Markets from 2015 to 2017, focusing on unsecured funding planning, execution, and risk management. He graduated magna cum laude from Boston College in 2015 with a B.A. in International Studies, concentrating in Economics. In 2020, he earned a Certificate in Advanced Valuation from NYU Stern. He is also a Chartered Financial Analyst (CFA) charterholder.