

Positioning for a Potential Recovery with Small Cap Stocks
Published August 8, 2013

Global Head of Research
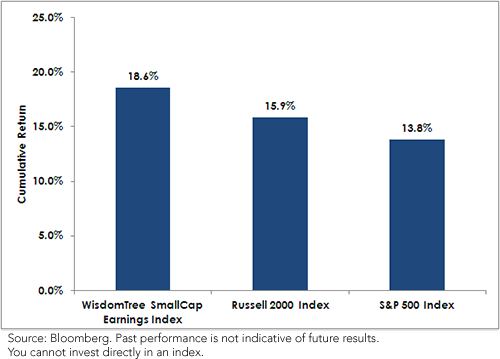
After the S&P 500 Index hit record highs during the first half of 2013, many now believe that the U.S. economy is heading toward a point of inflection. One of the single largest market-moving influences of late has been the different tone coming out of the U.S. Federal Reserve. Since the 2008–09 global financial crisis, U.S. equity markets have enjoyed an environment of accommodative monetary policy. If this should change, a crucial question regards how equity markets might respond. WisdomTree SmallCap Earnings Index (WTSEI): Outperformance (12/31/2012–6/30/2013)
Average Annual Returns (as of 6/30/2013)
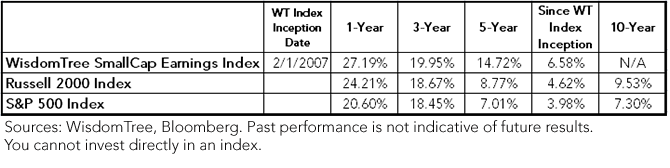
• WTSEI Performed Strongly: Whether one looks at a year-to-date, one-year, three-year, five-year or even since-inception return, WTSEI has done well compared to the Russell 2000 Index and the S&P 500 Index, possibly the most widely followed measure of U.S. equity market performance. • Consumer Discretionary: The changing tone coming out of the U.S. Federal Reserve could signal an improving U.S. economic picture. If this is indeed the case, U.S. consumers may ultimately pick up their consumption. Compared to the Russell 2000 Index, WTSEI had an approximate 5% over-weight (approx. 19% vs. 14%) in this sector during the first half of 2013. The S&P 500 Index had about 12% weight in this sector. Performance for Consumer Discretionary stocks within each index for the period was approximately 39% for WTSEI, 32% for the Russell 2000 and 20% for the S&P 500. This coincides with a broader measure of exposure to the more defensive sectors—sectors that may underperform if the U.S. economy continues to improve. As of June 30, 2013, defensive sector exposure was at approx. 13% for WTSEI, 20% for the Russell 2000 and 30% for the S&P 500. Navigating the Inflection Point Small-cap stocks—and WTSEI in particular—offer an interesting means through which to navigate the changing U.S. economic landscape. We see three crucial distinguishing factors that lead us to this conclusion: 1. Exposure to U.S.-generated revenues 2. Lower leverage and lower long-term debt to equity 3. Attentiveness to relative valuation Exposure to U.S.-Generated Revenues In essence, if the Fed deems the economy to be stable enough to handle less accommodative policy, growth must be relatively strong compared to even a few short years ago. As a result, some might be looking at the equity markets from the perspective of which types of companies may be more exposed to U.S.-generated revenues—thereby being in a prime position to benefit from an improving U.S. economic picture. As of June 30, 2013, whether one looks at the weighted average revenues of the top 10 U.S. constituents of WTSEI or the Russell 2000 Index, the figure is over 80%. This compares to less than 50% for the S&P 500 Index, a commonly used measure of U.S. large caps. Therefore, if sensitivity to U.S. economic strength is desired, this is one argument for thinking about small-cap stocks. Lower Leverage and Lower Long-Term Debt to Equity If the Fed is to actually follow through on its plan to abandon its monetary purchases, a potential side effect of this policy could be rising interest rates. Long-Term Debt to Equity & Leverage as of June 30, 2013
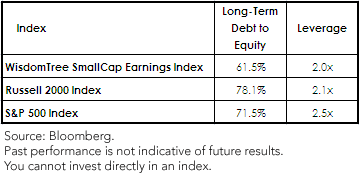
Long-term debt to equity and leverage are two measures that can be used to gauge potential sensitivity to rising interest rates. How is this? Well, both of these metrics indicate the propensity of index constituents to employ borrowed money, and firms with higher borrowing needs may be faced with a more difficult situation if interest rates rise, as their costs could increase. Generally speaking, the small-cap stock indexes shown (WTSEI and the Russell 2000) have lower leverage than the S&P 500. While true that it may be easier for larger firms to employ greater leverage at a lower cost, we believe it is still worth pointing out this important difference. On the other hand, the long-term debt to equity picture does not offer as clearly stratified an illustration across the capitalization spectrum. WTSEI is on the lower end of the three indexes shown. Attentiveness to Relative Valuation In this piece, the first thing we discussed was the strong relative performance of WTSEI. One of the most important considerations after a period of such outperformance regards valuation. Have the stocks themselves started to become expensive? WTSEI is weighted by the Earnings Stream as opposed to market capitalization like the Russell 2000 Index. What this means is that to garner a greater share of WTSEI’s weight, a firm must generate not only positive earnings (firms with negative earnings are not eligible at the Index screening date) but more positive earnings than other firms. What that tends to do is lower the price-to-earnings (P/E) ratio compared to market capitalization-weighted indexes of similar universes of stocks. As of June 30, 2013, WTSEI had a P/E ratio of 15.8x, whereas the Russell 2000 Index had a P/E ratio of 22.5x. Conclusion WTSEI performed strongly during the first half of 2013, and we believe a foundation is in place upon which the Index could remain well-positioned for changing U.S. monetary policy. It is interesting to us that the Index’s largest over-weights compared to the Russell 2000 Index as of June 30, 2013, are in Consumer Discretionary and Industrials. If in fact the U.S. economy is improving, those sectors have the potential to benefit from a stronger U.S. consumer and an increased demand for products. Unless otherwise stated, data source is Bloomberg.
Important Risks Related to this Article
Investments focusing on certain sectors and/or smaller companies increase their vulnerability to any single economic or regulatory development.
Categories
About the contributor

Global Head of Research
Christopher Gannatti began at WisdomTree as a Research Analyst in December 2010, working directly with Jeremy Schwartz, CFA®, Director of Research. In January of 2014, he was promoted to Associate Director of Research where he was responsible to lead different groups of analysts and strategists within the broader Research team at WisdomTree. In February of 2018, Christopher was promoted to Head of Research, Europe, where he was based out of WisdomTree’s London office and was responsible for the full WisdomTree research effort within the European market, as well as supporting the UCITs platform globally. In November 2021, Christopher was promoted to Global Head of Research, now responsible for numerous communications on investment strategy globally, particularly in the thematic equity space. Christopher came to WisdomTree from Lord Abbett, where he worked for four and a half years as a Regional Consultant. He received his MBA in Quantitative Finance, Accounting, and Economics from NYU’s Stern School of Business in 2010, and he received his bachelor’s degree from Colgate University in Economics in 2006. Christopher is a holder of the Chartered Financial Analyst Designation.