

Two Monetary Assets Walk into a Ratio
Published May 5, 2026

Christopher Gannatti, CFA
Global Head of Research

Dovile Silenskyte
Director, Digital Assets Research
Key Takeaways
- As of March 2026, the Bitcoin-to-gold ratio sat well below the Bitcoin in Gold (BiG) model’s fair value, suggesting macro conditions like a weaker dollar, elevated inflation expectations and strong ETF inflows are not yet fully reflected—highlighting a potential relative opportunity via spot Bitcoin ETPs versus gold allocations.
- While rising inflation expectations, equity momentum and institutional demand typically favor Bitcoin over gold, risk-off scenarios or inflation shocks could still drive near-term gold outperformance, reinforcing the case for dynamic allocation across both assets rather than a single directional bet.
- The BiG framework shifts investors from making outright price predictions to assessing relative value across macro scenarios, offering a more tactical way to position between Bitcoin ETPs and gold strategies as probabilities evolve with changing market data.
Bitcoin and gold are responding to the same forces. The ratio tells you which one the market is favoring right now.
Before asking where Bitcoin’s price is going, or where gold’s price is going, ask something more useful:
What should the relationship between these two assets look like, given everything happening in the world right now?
And then ask:
Is that actually what we're seeing?
These questions, deceptively simple, are the foundation of a model we have built. It’s called the Bitcoin in Gold model, or BiG for short. It doesn't predict a Bitcoin price. It doesn’t predict a Bitcoin price or a gold price. What it does is considerably more interesting, and understanding how it works may change the way you think about both assets.
Why a Ratio?
The idea of comparing two assets as a ratio, rather than tracking each one individually, isn’t new. Investors have followed the gold-to-silver ratio for decades, and it specifically measures how many ounces of silver it takes to buy one ounce of gold. Shifts in that ratio have historically told investors something meaningful about relative demand for each metal.1
- When the ratio gets very high, silver looks historically cheap relative to gold.
- When it compresses, the opposite is true.
The ratio doesn’t tell you that gold is definitely going up or silver is definitely going down; it tells you something about the relationship between them, which can be every bit as actionable.
Bitcoin and gold, it turns out, are well-suited to this kind of comparative analysis, for a specific reason:
They respond to many of the same underlying forces, just with different intensities.
Both are what you might call monetary assets, which is to say they’re not claims on a company’s earnings; they don’t pay dividends, and much of their perceived value comes from their role as stores of value outside the traditional financial system. When inflation expectations rise, both tend to benefit. When real interest rates climb, both tend to face headwinds. When the U.S. dollar strengthens, both typically feel pressure. When investors get nervous and seek safety, gold tends to outperform. When liquidity is abundant and risk appetite is strong, Bitcoin tends to surge. None of these reactions is set in stone, but these are patterns market participants have observed the price behaviors of bitcoin and gold.
Importantly, the two assets don't move in lockstep. They may lean in the same direction but with different sensitivity. Gold behaves more like a defensive anchor. Bitcoin behaves more like a high-octane, higher-volatility version of the same underlying impulse.
What the Model Actually Does
The BiG model was built to answer one question: given the current state of the world—across inflation, interest rates, the dollar, equity momentum, liquidity conditions, and institutional demand flows, where should the Bitcoin-to-gold ratio be?
The model draws on a set of inputs that, taken together, paint a reasonably complete picture of the macro environment:
- Inflation expectations, as measured by the U.S. 10-year breakeven rate.2
- The broad U.S. dollar index.3
- Equity momentum, using a trailing three-month return on the Nasdaq 100 Index as a measure of risk appetite.
- A factor combining commodity trends and foreign exchange dynamics.
- The net flows into U.S. spot Bitcoin exchange traded products, which have become a meaningful signal of institutional demand for the asset.
The model also incorporates structural shifts, including a post-2020 regime in which Bitcoin's role as a monetary asset became considerably more recognized, the institutional adoption wave following the January 2024 exchange traded product approvals,4 and so on.
Feed all of that into the model, and it produces a single output: a fair-value estimate for the Bitcoin-to-gold ratio. This is not a price target for Bitcoin, and this is not a price target for gold. It is a ratio, specifically the price of Bitcoin expressed in units of gold, calibrated to what current conditions would historically have implied.
Some may believe, independently, that gold is going to $3,500, $4,500 or $5,500 over the next twelve months, and the model tells you the Bitcoin-to-gold ratio should be 25; then you can do your own arithmetic. If you're more bearish on gold, or more bullish, you adjust accordingly. The model gives you a lens for the relationship, and you may bring your own views on the underlying assets. It's a framework, not a verdict.
When the Map and the Territory Diverge
The more revealing output of the model isn't the fair-value estimate alone, but rather the gap between that estimate and where the ratio is actually trading.
As of the end of March 2026, the actual Bitcoin-to-gold ratio stood at around 15.6. The model's fair-value estimate, based on the current macro environment, was around 21.1. That's a meaningful divergence. Bitcoin and gold prices are not where the model would expect them to be, relative to each other, given the prevailing conditions. We see this in Figure 1, which shows the actual ratio and the model’s predicted ratio going back to 2013.
Figure 1: The Actual Bitcoin/Gold Ratio Sits Clearly Below Model Estimate
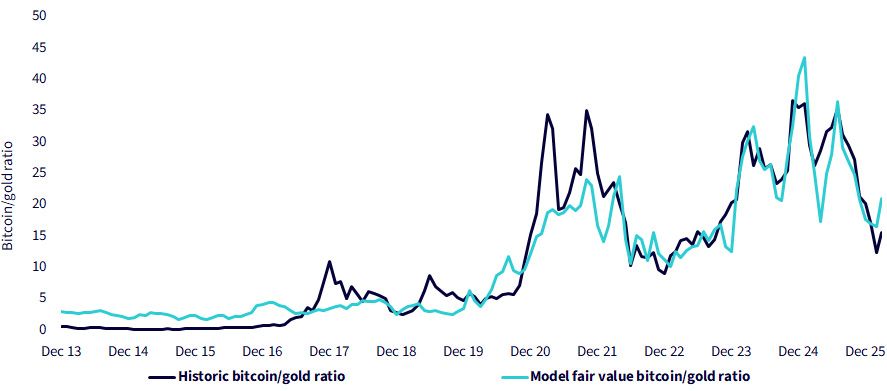
Source: WisdomTree, Stooq. December 31, 2013–March 31, 2026. Past performance is not indicative of future results.
Now, this is where the framing really matters. The temptation, and you see it constantly in financial commentary, is to immediately translate that gap into a directional call. Bitcoin is cheap—buy it! But that's not what the model is saying, and collapsing it into that kind of headline may risk missing most of what's actually interesting.
What the model is saying is something more nuanced.
The current macro environment could be specified, roughly, as:
- A softer dollar
- Inflation expectations running above historical norms
- Supportive equity momentum
- Steady institutional demand flowing into Bitcoin exchange traded products
has historically been the kind of backdrop that pushes the ratio higher, toward Bitcoin's favor. The model translates all of that into a fair-value estimate of around 21. The actual ratio is 15.6. In other words, the conditions exist for Bitcoin to be trading at a meaningful premium to gold. It isn't. And the gap between those two facts is where the real conversation begins.
The gap is a question, not an answer. It invites you to think about why the ratio might be sitting where it is, and what would have to happen for it to move.
Thinking in Scenarios, Not Predictions
Here is where the model becomes genuinely distinctive. Rather than producing a single twelve-month forecast, which would imply a false precision that no honest model can claim, it frames the future as a set of possible macro environments, each with its own implications for the ratio, and each with a probability derived from today's data.
The model considers twelve such scenarios, ranging from "no new shocks, current conditions continue" all the way to less probable but entirely possible environments like currency fragmentation or a productivity boom. As of the most recent data, the three scenarios assigned the highest probability were:
- The current environment continues with no major shocks.
- An inflation shock in which breakeven inflation rates rise sharply and macro conditions tighten.
- A risk-off scenario in which the dollar strengthens and investors pull back from higher-risk assets.
The scenario probabilities aren't guesses or intuitions. They emerge from comparing the current macro snapshot against what each scenario would look like in the model's terms, and calculating how close today's conditions sit to each of those hypothetical environments. As the data changes month to month, the probabilities shift. A scenario that looks remote in March might look considerably more probable in May, if the intervening weeks bring the kind of macro developments that align with it. The model updates, and the ranking updates with it.
What makes this useful is that the three top scenarios point in meaningfully different directions for the ratio.
- Under the current-no-shock scenario, the ratio drifts only modestly over twelve months; not much changes, and the gap closes slowly, if at all.
- Under an inflation shock, the dynamics are more complex: gold tends to benefit first as investors seek inflation protection in the more familiar asset, but as the shock works through the system, the model suggests Bitcoin can recover as higher inflation expectations and mean-reversion pressure reassert themselves.
- Under a risk-off scenario, gold outperforms more clearly, the dollar strengthens, risk appetite contracts, and Bitcoin bears the brunt of that rotation.
Each of these paths leads somewhere different. And the honest answer is that we don't know which one we're on. What we do know is which one looks most probable right now, and what the ratio would likely do in each case.
Figure 2 shows how the model predicts the ratio may evolve, 12 months from now, given these different scenarios.
Figure 2: Scenario Paths for the Bitcoin/Gold Ratio
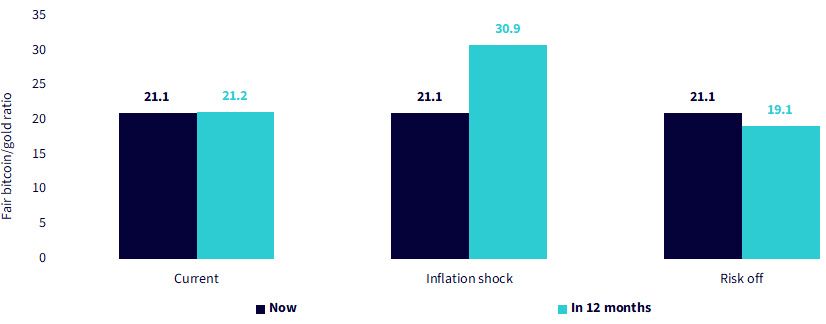
Source: WisdomTree. April 7, 2026. Model assumes the macro scenario starts on April 1, 2026 and continues for the next 12 months. Past performance is not indicative of future results.
The Mental Model Shift
It's worth pausing on what this framework is actually offering, because it runs against the grain of how most people talk about these assets.
The dominant mode of Bitcoin commentary is prediction, which may reference such things as price targets, cycle theories, halving models, and other on-chain metrics extrapolated into forecasts. Much of the gold commentary sounds similar, discussing geopolitical risk premiums, central bank demand, and dollar debasement narratives leading to specific price conclusions. These are not worthless. Some of them are quite thoughtful. But they all share a structure: they try to tell you where the asset price is going.
The BiG model's structure is different. It doesn't try to tell you where Bitcoin is going, or where gold is going. It tries to tell you whether Bitcoin is expensive or inexpensive relative to gold, given what the macro environment says that relationship should look like. It also tries to show you how that relationship might evolve under different plausible futures, rather than under just one.
This is, in a quiet way, a more intellectually honest approach. It acknowledges that nobody knows which scenario will unfold. It also acknowledges that the gap between fair value and actual value can close in multiple ways. It respects the complexity of these assets while still offering a coherent analytical structure. And it gives you something concrete to update as new data comes in each month, the picture changes, and you can see how it changes and why.
A Final Word on What Models Can and Cannot Do
A model like this is only as good as its foundations, and it's worth being clear-eyed about what those are.
The BiG model is built on monthly data going back to the end of 2013, essentially the full history of Bitcoin as a traded asset. It was built using a form of regression that was selected specifically because simpler approaches turned out to have statistical problems that this one avoids. It evaluates its own accuracy against out-of-sample data, and it gets the direction of ratio changes right roughly sixty percent of the time, meaningfully better than random, though certainly not infallible. It outperforms the simpler benchmark it was compared against, but the margin is modest, which is the honest result.
What the model cannot do is account for genuinely unprecedented events, or for structural changes in the relationship between Bitcoin and gold that haven't yet shown up in the data. It is a tool for thinking, not a substitute for it. The value it offers is a more rigorous framework for asking the right questions which, in markets, is often more than half the battle.
The ratio of Bitcoin to gold is telling us something right now. What it's telling us isn't a simple buy or sell signal. It's an invitation to look more carefully at the macro environment, to think through which scenarios seem most plausible, and to ask what each of those would mean for how these two assets should relate to each other. For anyone paying serious attention to either asset, that is a question worth asking.
- Source: CME Group. Gold-silver ratio: Understanding precious metals relationships.
- The U.S. 10-year breakeven rate is the difference between nominal Treasury yields and TIPS yields, representing the market’s implied average inflation expectation over the next ten years.
- The Federal Reserve Broad Trade-Weighted U.S. Dollar Index measures the dollar’s value against a wide basket of global currencies, weighted by U.S. trade shares, reflecting overall competitiveness and international purchasing power.
- Source: U.S. Securities and Exchange Commission. (January 10, 2024). Statement on the approval of spot bitcoin exchange-traded products.
Important Risks Related to this Article
There are risks associated with investing, including the possible loss of principal. Past performance is not indicative of future results.
Bitcoin is highly speculative and involves a high degree of risk, including the potential for loss of the entire investment. An investment in bitcoin involves significant risks (including the potential for quick, large losses) and may not be suitable for all investors.
The price of gold fluctuates and may be affected by numerous factors including supply and demand, the global financial markets and other political, financial, or economic events, which may negatively impact gold prices.
This material contains the opinions of the authors, which are subject to change, and should not be considered or interpreted as a recommendation to participate in any particular trading strategy or deemed to be an offer or sale of any investment product, and it should not be relied on as such. There is no guarantee that any strategies discussed will work under all market conditions. This material represents an assessment of the market environment at a specific time and is not intended to be a forecast of future events or a guarantee of future results. This material should not be relied upon as research or investment advice regarding any security in particular. The user of this information assumes the entire risk of any use made of the information provided herein. Unless expressly stated otherwise, the opinions, interpretations or findings expressed herein do not necessarily represent the views of WisdomTree or any of its affiliates.
Categories

About the contributors

Christopher Gannatti, CFA
Global Head of Research
Christopher Gannatti began at WisdomTree as a Research Analyst in December 2010, working directly with Jeremy Schwartz, CFA®, Director of Research. In January of 2014, he was promoted to Associate Director of Research where he was responsible to lead different groups of analysts and strategists within the broader Research team at WisdomTree. In February of 2018, Christopher was promoted to Head of Research, Europe, where he was based out of WisdomTree’s London office and was responsible for the full WisdomTree research effort within the European market, as well as supporting the UCITs platform globally. In November 2021, Christopher was promoted to Global Head of Research, now responsible for numerous communications on investment strategy globally, particularly in the thematic equity space. Christopher came to WisdomTree from Lord Abbett, where he worked for four and a half years as a Regional Consultant. He received his MBA in Quantitative Finance, Accounting, and Economics from NYU’s Stern School of Business in 2010, and he received his bachelor’s degree from Colgate University in Economics in 2006. Christopher is a holder of the Chartered Financial Analyst Designation.

Dovile Silenskyte
Director, Digital Assets Research
Dovile Silenskyte is a director of digital assets research at WisdomTree. Before joining WisdomTree in May 2024, Dovile worked as an index equity product strategist at BlackRock. Currently, she is responsible for conducting analyses for in-house digital assets publications and assisting the sales team with client queries about products and markets. Dovile holds an MSc in Finance from Texas A&M University – Commerce, and she is also a chartered financial analyst (CFA).