
What’s Hot—and What’s Not—in Emerging Markets So Far in 2025
Published April 3, 2025

Global Head of Research
Key Takeaways
- In 2025, emerging markets are anything but uniform, with Poland up over 35% while Thailand has plunged nearly 12%, highlighting the massive dispersion beneath the modest 5.7% year-to-date gain of the MSCI Emerging Markets Index.
- Latin America has quietly outperformed thanks to stability and low expectations, while parts of Asia have disappointed due to weak exports, political uncertainty and fading commodity tailwinds.
- The WisdomTree Emerging Markets High Dividend Fund (DEM) aims to thrive on yield and value in politically re-rating markets like Poland and Colombia, the WisdomTree Emerging Markets SmallCap Dividend Fund (DGS) captures overlooked local stories in smaller geographies, and the WisdomTree Emerging Markets Quality Dividend Growth Fund (DGRE) targets long-term growth through quality exposure in structurally growing markets like India.
Emerging Market Equities in 2025: Same Index, Different Worlds
In investing, averages often conceal more than they reveal. Nowhere is that more true than in emerging markets (EM).
The headline number says EM equities1 are up 5.7% year-to-date—decent, if unremarkable. But tilt the lens even slightly, and a different picture emerges: Poland is up over 35%, while Thailand is down nearly 12%.2 That's not dispersion, that's a chasm.
Bundling these markets under a single "EM" label is like saying deserts and rainforests behave the same because they're both climates. 2025 isn't telling one EM story—it's telling dozens.
Eastern Europe's Confidence Trade
Poland, Hungary, Czech Republic, Greece—what unites them isn't growth. It's the return of belief.
Poland's pivot toward European Union (EU) alignment has unlocked long-frozen funding. Markets are cheering the thaw. Hungary, once Brussels' outlier, is seeing détente and a dovish central bank feed a local rally. Greece—once a byword for sovereign risk—is now a case study in reform, with surging tourism, recapitalized banks and even credit upgrades.3
When dysfunction gets repriced, the upside can be explosive.
LatAm: The Silent Surge
Colombia, as an equity market, rarely makes the EM highlight reel. Yet it's 2025's second-best performer.4 Oil helped, yes. But more important was what didn't happen: no currency collapse, no policy shock. Valuations were low, expectations lower.
Asia's Unexpected Drag
Emerging Asia was supposed to be the engine. Instead, it's been the anchor.
Thailand hasn't turned China's reopening into returns. Political drift and weak exports, especially in autos and electronics, have weighed heavily. Indonesia's commodity story lost steam as nickel prices slumped and EV optimism cooled. Election-year jitters didn't help.5
Malaysia is mired in state-heavy stagnation. Taiwan, despite semis, can't outrun geopolitics.6
Figure 1: Top 5 and Bottom 5 Emerging Markets Equity Returns by Country Index
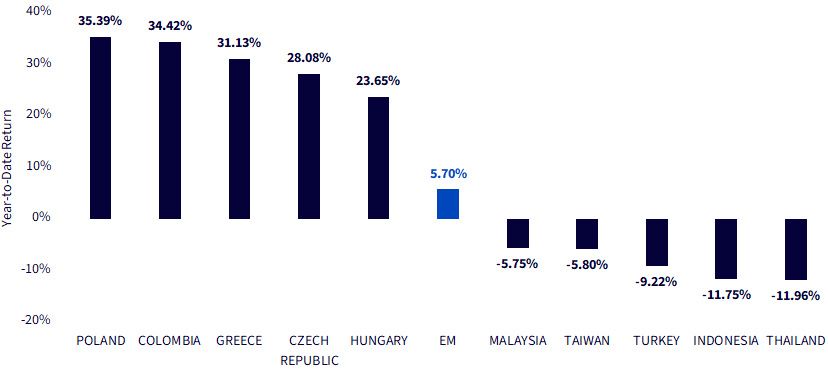
Source: MSCI. Each label on the horizontal axis references an MSCI index, e.g., the MSCI Poland Index, the MSCI Colombia Index. EM refers to the benchmark MSCI Emerging Markets Index. Returns are 1/1/25–3/26/25. Past performance is not indicative of future returns. You cannot invest directly within an index.
There Are Many Flavors of Emerging Markets Equities
WisdomTree has a range of options for EM equities, a number of which have been around for longer than 10 years.
- The WisdomTree Emerging Markets Quality Dividend Growth Fund (DGRE) seeks to track the investment results of dividend-paying companies with growth characteristics in the EM region.
- The WisdomTree Emerging Markets High Dividend Fund (DEM) seeks to track the total return performance, before fees, of the WisdomTree Emerging Markets High Dividend Index. The focus is on potential higher-yielding dividend payers within EM.
- The WisdomTree Emerging Markets SmallCap Dividend Fund (DGS) seeks to track the total return performance, before fees, of the WisdomTree Emerging Markets SmallCap Dividend Index. The focus is on dividend-paying smaller market capitalization stocks within EM.
The most widely followed EM equity performance benchmark is the MSCI Emerging Markets Index.
Figure 2: Standardized Performance
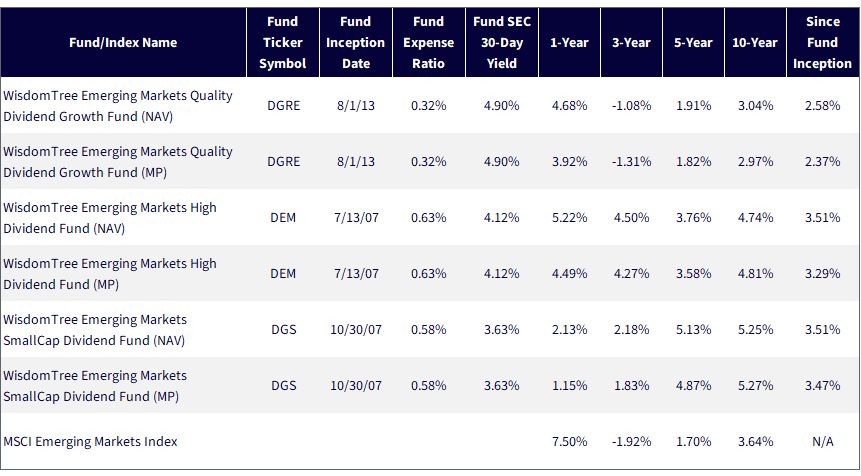
Source: WisdomTree, specifically data from the Fund Comparison Tool in the PATH suite of tools, accessed 3/27/25 with returns as of 12/31/24. 30-Day SEC Yield as of 12/31/24. NAV denotes total return performance at net asset value. MP denotes market price performance. Past performance is not indicative of future results. Investment return and principal value of an investment will fluctuate so that an investor's shares, when redeemed, may be worth more or less than their original cost. Current performance may be lower or higher than the performance data quoted. For the most recent month-end and standardized performance and to download the respective Fund prospectuses, click the relevant ticker: DGRE, DEM, DGS.
Understanding EM Factor Performance through WisdomTree's Lens
EM is notoriously cyclical and style-sensitive.7 In 2025, that's not just theory—it's in the numbers. Factor exposures are defining return paths, and WisdomTree's EM strategies—DGRE (dividend growth), DEM (high dividend) and DGS (small cap)—offer a sharp view into how those paths have been diverging over different time frames.
YTD 20258: High Dividend Outperforms, Small Caps Struggle
It's a market favoring value over growth, large over small.9 DEM's strength reflects what's working—dividend-rich sectors like financials and energy, and countries like Poland, Hungary and Colombia, which are re-rating on renewed political and economic stability.
DGRE's softness reveals a market still cautious on duration. With global rates sticky and risk appetite fragile, investors are favoring cash now over growth later. Small caps, represented by DGS, are being left behind—particularly in Asia, where sentiment hasn't lifted the broader base.
1-Year & 3-Year: Value Has Been Winning
These timeframes capture the post-2022 rotation—when investors fled duration and tech risk in favor of cash-flow-heavy names. DEM's tilt toward financials, energy and telecoms positioned it perfectly for this macro regime of elevated real interest rates and geopolitical risks.
5-Year: The Small-Cap Revival
This was small caps' moment. DGS captured the rebound from COVID, the 2022 commodity surge, and the outperformance of local stories across Latin America and ASEAN. It's a reminder: when domestic demand reasserts itself, smaller companies can punch above their weight.
DEM still held strong, proving that high-yield strategies weren't just defensive—they thrived in a world recalibrating to lower real rates.
10-Year: Long-Term Factor Edge
Long-term, DEM and DGS both outpaced the benchmark—showing that factors, when thoughtfully applied, can beat market averages in EM. DGRE lagged.
Figure 3: Different Performance Leadership on Different Time Horizons
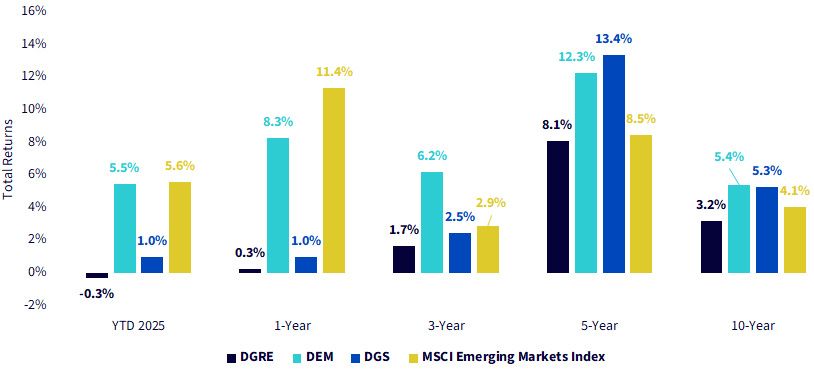
Source: WisdomTree, specifically data from the Fund Comparison Tool in the PATH suite of tools, accessed 3/27/25 with returns as of 3/26/25. NAV denotes total return performance at net asset value. Past performance is not indicative of future results. Investment return and principal value of an investment will fluctuate so that an investor's shares, when redeemed, may be worth more or less than their original cost. Current performance may be lower or higher than the performance data quoted. For the most recent month-end and standardized performance and to download the respective Fund prospectuses, click the relevant ticker: DGRE, DEM, DGS.
Emerging Markets, Reimagined: A Geography of Risk and Reward
Together China and Taiwan make up around half of the MSCI Emerging Markets Index. But WisdomTree's dividend strategies tell a different story—one where regional exposures reflect very different sensitivities to risk, policy and future growth potential.
DEM has a higher exposure to China, while DGS tilts a lot more exposure to Taiwan. DGRE has no exposure to China, tilting a lot more to Taiwan and India.
Relative to the MSCI Emerging Markets Index, DGRE's exposure of roughly 30% to India represents a very strong conviction. There is a belief that India's growth story, still early in its institutional arc, has more room to run—and that the equity market is just beginning to reflect it.
Figure 4: Mapping the Primary Market Exposures across the Different EM Strategies
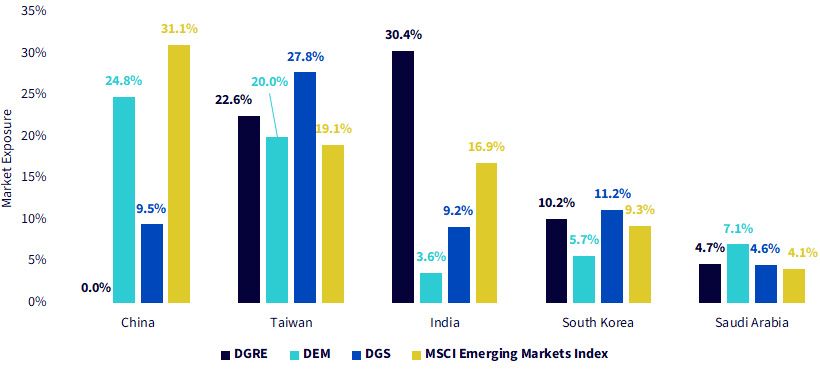
Sources: WisdomTree, FactSet, MSCI. Data accessed from the Fund Compare Tool in WisdomTree's PATH set of tools, as of 2/28/25 and represents exposure to the top 5 country and market exposures of the MSCI Emerging Markets Index as of that date. Holdings subject to change.
What a Dividend Yield May Reveal
In EM, yield isn't just a number—it's a window into what a strategy believes the future will look like.
DEM is clear in its message: income first. With a dividend yield of 6.86%, it more than doubles the MSCI EM Index. This is a portfolio designed for cash flows today, not promises tomorrow. It leans into state-owned enterprises, banks, energy names.
DGS takes a similar approach, but through a small-cap lens. At 4.40%, its yield suggests a different profile—less about size, more about where in the market cycle these companies sit. These may be overlooked names in overlooked geographies, but with the ability to potentially throw off real income when the macro tide turns in their favor.
Then there's DGRE, sitting at 2.78%, clearly telling a different story. This is a strategy for those who want growth—just not at any price. Quality matters. Reinvestment matters. It's about finding companies with the capacity to grow dividends over time, not just pay them today.
Figure 5: What the Dividend Yield May Reveal
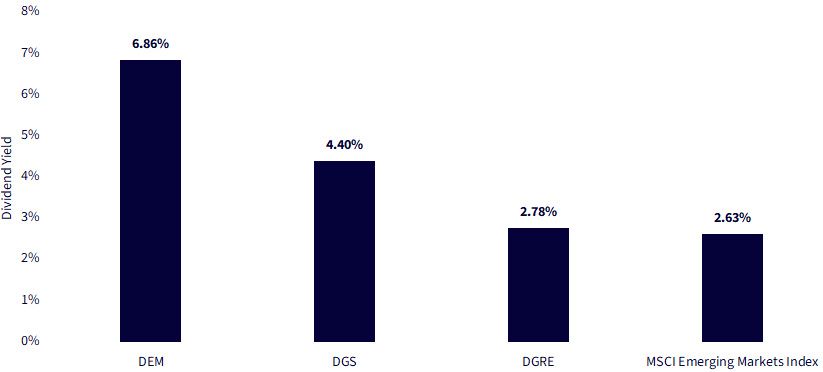
Source: WisdomTree, FactSet, specifically data from the Fund Comparison Tool in the PATH suite of tools, accessed 3/27/25 with dividend yields as of 2/28/25. Past performance is not indicative of future results. Investment return and principal value of an investment will fluctuate so that an investor's shares, when redeemed, may be worth more or less than their original cost. Current performance may be lower or higher than the performance data quoted. For the most recent month-end and standardized performance and to download the respective Fund prospectuses, click the relevant ticker: DGRE, DEM, DGS.
What Are You Really Paying For?
Once you know where a strategy is positioned and how much income it throws off, the final question becomes: what's the price?
Valuation isn't just a number—it's a story investors are telling about what they expect next. And right now, those stories vary widely across WisdomTree's EM dividend strategies.
DEM trades at just 7.98x forward earnings. That's not a typo—that's deep into value territory. It reflects companies the market has discounted, sometimes aggressively, for political risk, volatility or sluggish growth. But for investors willing to stomach that risk, DEM offers a simple proposition: potential high dividend yield at a low price.
DGS, at 10.79x, plays a different game. It tilts toward smaller, domestically focused firms with enough earnings stability to justify a moderate premium.
DGRE, at 13.89x, is the high-conviction outlier. It's not trying to be inexpensive. It's targeting quality—companies with strong balance sheets, steady growth and capital discipline. It leans into India, where investors are paying up for structural stories, not cyclical rebounds. DGRE is for those who believe paying a premium today can lead to the possibility of better compounding tomorrow.
Figure 6: What Are You Really Paying for?
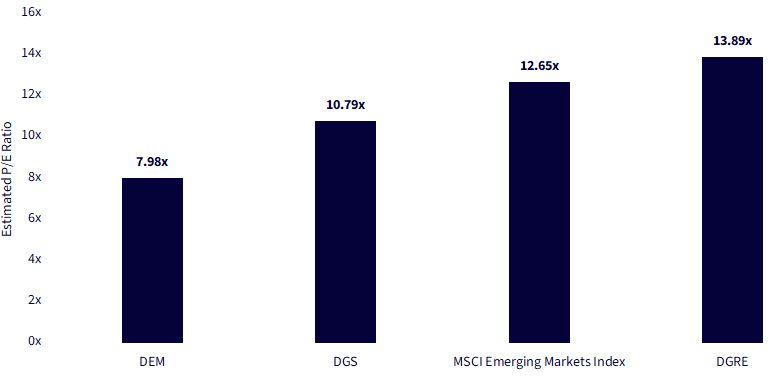
Source: WisdomTree, FactSet, specifically data from the Fund Comparison Tool in the PATH suite of tools, accessed 3/27/25 with estimated P/E ratios as of 2/28/25. Past performance is not indicative of future results. Investment return and principal value of an investment will fluctuate so that an investor's shares, when redeemed, may be worth more or less than their original cost. Current performance may be lower or higher than the performance data quoted. For the most recent month-end and standardized performance and to download the respective Fund prospectuses, click the relevant ticker: DGRE, DEM, DGS.
Where's the Earnings Growth?
Here, DGRE pulls ahead with conviction. Its companies grew earnings by a median 13.2% over the last year, 20.1% annually over three years and 14.9% over five. These are businesses that consistently reinvest, expand and deliver. DGRE wears the label "dividend strategy," but under the hood, it behaves more like a quality-growth compounder.
DGS plays a more balanced hand. Its median one-year and five-year growth figures—9.8% and 10.8%, respectively—suggest companies that may not be market darlings, but are still building real value. These are smaller, less-followed firms that may benefit from local tailwinds and operating leverage.
Then there's DEM, where the trade-off becomes clearest. Median earnings growth barely cleared 0.7% over the past year and is just 4.4% annually over three years. Even the five-year number, 7.2%, lags well behind. This is the price of deep value: high yield today, but lower reinvestment, slower growth and more dependency on external catalysts—macro shifts, policy changes or re-rating events—to potentially unlock upside.
The lesson here is simple: in EM equities, growth doesn't always show up where the yield is highest.
Figure 7: Where Is the Earnings Growth?
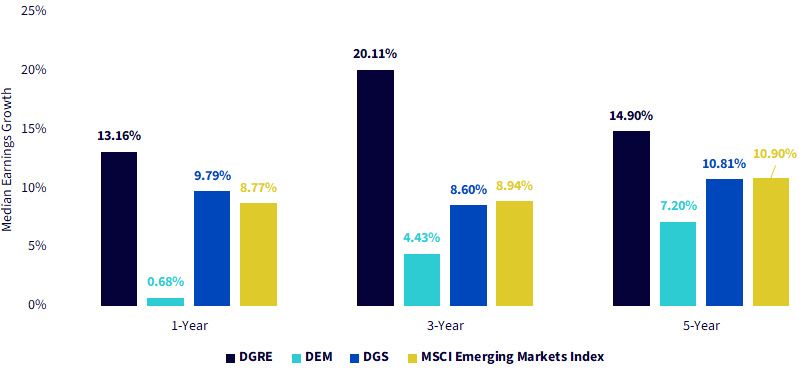
Source: WisdomTree, FactSet, specifically data from the Fund Comparison Tool in the PATH suite of tools, accessed 3/27/25 with median earnings growth as of 2/28/25. Past performance is not indicative of future results. Investment return and principal value of an investment will fluctuate so that an investor's shares, when redeemed, may be worth more or less than their original cost. Current performance may be lower or higher than the performance data quoted. For the most recent month-end and standardized performance and to download the respective Fund prospectuses, click the relevant ticker: DGRE, DEM, DGS.
Conclusion: The Map Is Not the Territory
EM isn't an asset class. It's a mosaic—of risk regimes, reform cycles and investor expectations. In 2025, the spread between winners and losers isn't a rounding error—it's the entire story.
That's why the right EM exposure isn't about finding the best "average." It's about picking your narrative. Do you want yield and patience? DEM. Local conviction and leverage to domestic rebounds? DGS. Long-term compounding in places like India? DGRE.
Investors often ask what's in EM. The better question is: what are you betting on?
Because in EM, more than anywhere else, you're not just buying markets. You're underwriting belief.
1 Refers to the MSCI Emerging Markets Index universe.
2 Return figures are sourced from MSCI and refer to the period 1/1/25–3/26/25. Country universes are defined by the MSCI Poland Index and MSCI Thailand Index.
3 Sources: Stella Mazonakis, "Greek Tourism Booms in 2025 with Record January Surge, Bank of Greece Reports," Greek City Times, 3/28/25; https://www.state.gov/reports/2024-investment-climate-statements/greece/
4 Refers to the country index returns within the MSCI Emerging Markets Index universe, with the MSCI Colombia Index delivering the second strongest return for the period 1/1/25–3/26/25.
5 Refers to the MSCI Indonesia Index universe.
6 Refers to the MSCI Malaysia Index and MSCI Taiwan Index universes.
7 Style-sensitive can be thought of as factor-sensitive, meaning aspects such as market cap size, quality, momentum, value, growth and more can have outsized impact on returns over different periods.
8 In this context, YTD 2025 refers to the period 1/1/25–3/26/25.
9 Large over small refers to the difference in market capitalization size exposure, with large caps defined as above $10 billion in market cap, and small caps defined as below $2 billion in market cap.
Important Risks Related to this Article
There are risks associated with investing, including the possible loss of principal. Foreign investing involves special risks, such as currency fluctuations, political and economic uncertainty, and increased volatility. Investments in emerging, offshore or frontier markets are generally less liquid and less efficient than investments in developed markets and are subject to additional risks, including adverse governmental regulation, intervention and political developments. Funds focusing on a single sector may experience greater price volatility. Due to the Fund’s investment strategy, it may make higher capital gain distributions than other ETFs. Dividends are not guaranteed, and a company currently paying dividends may cease doing so at any time. Please read each Fund’s prospectus for specific details regarding the Fund’s risk profile.
About the contributor

Global Head of Research
Christopher Gannatti began at WisdomTree as a Research Analyst in December 2010, working directly with Jeremy Schwartz, CFA®, Director of Research. In January of 2014, he was promoted to Associate Director of Research where he was responsible to lead different groups of analysts and strategists within the broader Research team at WisdomTree. In February of 2018, Christopher was promoted to Head of Research, Europe, where he was based out of WisdomTree’s London office and was responsible for the full WisdomTree research effort within the European market, as well as supporting the UCITs platform globally. In November 2021, Christopher was promoted to Global Head of Research, now responsible for numerous communications on investment strategy globally, particularly in the thematic equity space. Christopher came to WisdomTree from Lord Abbett, where he worked for four and a half years as a Regional Consultant. He received his MBA in Quantitative Finance, Accounting, and Economics from NYU’s Stern School of Business in 2010, and he received his bachelor’s degree from Colgate University in Economics in 2006. Christopher is a holder of the Chartered Financial Analyst Designation.