
DGRW
U.S. Quality Dividend Growth Fund

Published February 7, 2025

Global Head of Research
We think 2025 can be different, and it's important to see what different dividend-oriented strategies are telling us.
We can pose a few questions to better understand the spectrum on which these different tools fall within the broader investment toolkit:
Which strategy has the potential to be well-positioned for a continuation of what we saw in 2023 and 2024?
If one's thesis is continued leadership of the Magnificent 7 driving the U.S. equity market forward, QGRW has the strongest exposure to these stocks. DGRW also includes many of them, but the dividend requirement does preclude it from including Amazon or Tesla. It's also the case that DGRW's dividend weighting doesn't include these companies in as large an exposure as QGRW's market cap-weighting approach.
Which strategy has the potential to be well-positioned for a volatile, possibly downward-trending, market correction?
If one is thinking about playing defense rather than offense in U.S. equity markets, DHS is a strategy that could make sense. Higher-yielding dividend payers tend to be in sectors like Utilities or Consumer Staples that have a more defensive, slower growth orientation. We'd note that DGRW's orientation of only including dividend payers is also helpful in a more negative equity market. WTV is also interesting in this context, as its strategy finds companies doing significant share buybacks. We shall see that, like DHS, it has very inexpensive valuation metrics, but it is not confined solely to higher-yielding dividend payers.
Which strategy has the best potential to allow investors to weather different market environments without needing to have a specific view?
We recognize that all investors are different—some are thinking week-by-week, and some are thinking about the next 10 years. DGRW's approach, which includes dividend-paying companies weighted by dividends but also ensures those companies have strong growth and quality characteristics, places it in the middle of the road in many aspects. The dividend weighting, for example, tends to help mitigate the risk that the strategy's valuation metrics rise dramatically relative to the market. Similarly, the focus on earnings growth and quality characteristics tends to generate more exposure to growth-oriented companies that are still paying dividends—like Apple and Microsoft, which are some of the biggest payers of cash dividends in the world.
DHS was running into the wind during the Magnificent 7's run in 2023 and 2024.
QGRW has been strong—but big exposure across the Magnificent 7 may not be ideal if the market becomes more defensively oriented. In some discussions, we have seen investors thinking about pairing QGRW, with its focus on larger, higher-growth companies, with WTV, and its focus on much lower valuations.
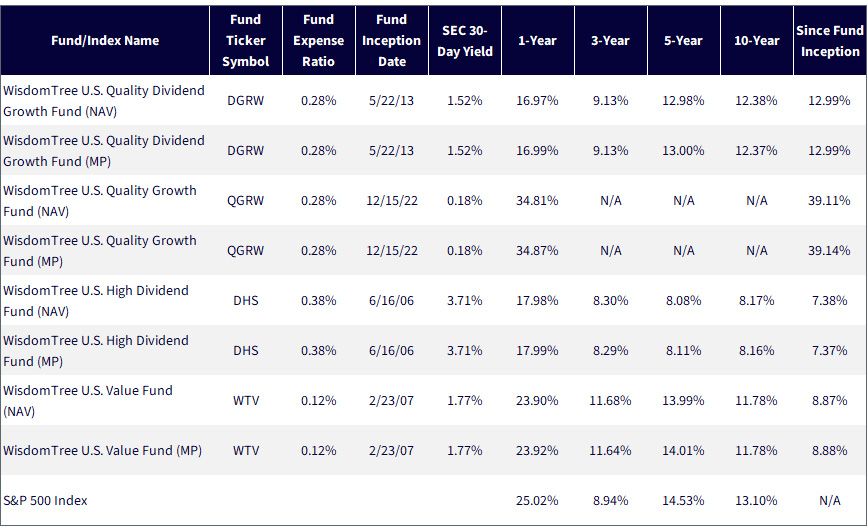
Source: WisdomTree, specifically data from the Fund Comparison Tool in the PATH suite of tools, accessed 1/14/25, with returns as of 12/31/24. SEC 30-Day Yield as of 12/31/24. The 30-Day Yield represents net investment income earned by the Fund over the 30-Day period ended 12/31/2024, expressed as an annual percentage rate based on the Fund's share price at the end of the 30-Day period. NAV denotes total return performance at net asset value. MP denotes market price performance. In the case of WTV, the Fund's objective changed effective 12/18/17. Prior to 12/18/17, Fund performance reflects the investment objective of the Fund when it tracked the performance, before fees and expenses, of the WisdomTree U.S. LargeCap Value Index. Dividends aren't guaranteed. Past performance is not indicative of future results. Investment return and principal value of an investment will fluctuate so that an investor's shares, when redeemed, may be worth more or less than their original cost. Current performance may be lower or higher than the performance data quoted. For the most recent month-end and standardized performances and to download the respective Fund prospectuses, click the relevant ticker: DGRW, DHS, QGRW, WTV.
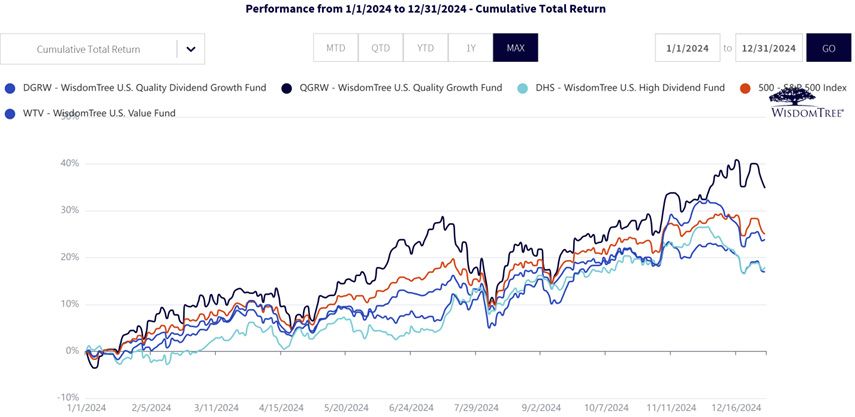
As we see in figure 2, 2024 was another year of growth leadership, and QGRW was ideally positioned. Placing large weights in fundamentally sound, strongly growing companies was a road to very strong performance. It was also the case that focusing solely on dividend payers was not the route to the strongest performance in 2024.
Source: WisdomTree, specifically data from the Fund Comparison Tool in the PATH suite of tools, accessed 1/14/25. NAV denotes total return performance at net asset value. MP denotes market price performance. In the case of WTV, the Fund's objective changed effective 12/18/17. Prior to 12/18/17, Fund performance reflects the investment objective of the Fund when it tracked the performance, before fees and expenses, of the WisdomTree U.S. LargeCap Value Index. Dividends aren't guaranteed. Past performance is not indicative of future results. Investment return and principal value of an investment will fluctuate so that an investor's shares, when redeemed, may be worth more or less than their original cost. Current performance may be lower or higher than the performance data quoted. For the most recent month-end and standardized performances and to download the respective Fund prospectuses, click the relevant ticker: DGRW, DHS, QGRW, WTV.
After two years of strong performance, there is a mental trap that many investors may fall into—an assumption that the same large companies that have led the way will simply always lead the way. The start of 2025 is a good reminder that there is no one strategy that delivers the strongest performance all of the time.
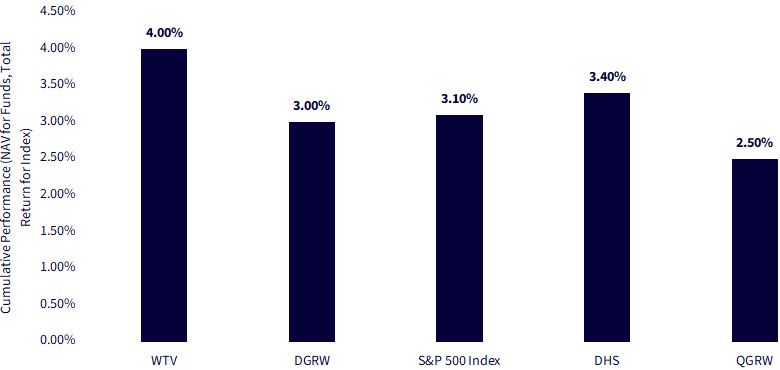
DGRW, at least during the first two weeks of 2025, has provided some downside risk mitigation, outperforming QGRW by about 90 basis points.
WTV, again over this short period, has provided a slight positive return.
Source: WisdomTree, specifically data from the Fund Comparison Tool in the PATH suite of tools, accessed 2/6/25. Period is from 1/1/25 to 2/5/25. NAV denotes total return performance at net asset value. MP denotes market price performance. In the case of WTV, the Fund's objective changed effective 12/18/17. Prior to 12/18/17, Fund performance reflects the investment objective of the Fund when it tracked the performance, before fees and expenses, of the WisdomTree U.S. LargeCap Value Index. Past performance is not indicative of future results. Investment return and principal value of an investment will fluctuate so that an investor's shares, when redeemed, may be worth more or less than their original cost. Current performance may be lower or higher than the performance data quoted. For the most recent month-end and standardized performances and to download the respective Fund prospectuses, click the relevant ticker: DGRW, DHS, QGRW, WTV.
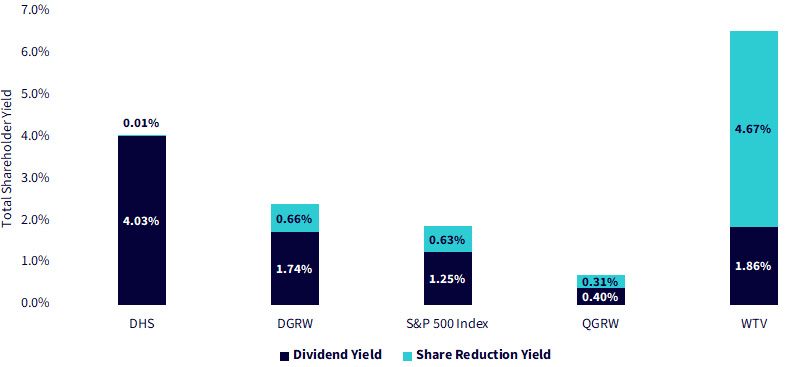
DHS, as we see in figure 4, has a much higher dividend yield than DGRW, QGRW and the S&P 500 Index. DGRW also has a dividend yield above that of the S&P 500 Index. It's important that investors understand this as they set their expectations and think about which funds might be better positioned for the environment they are preparing for.
In U.S. equities, companies can return money to shareholders by paying dividends or conducting share buybacks. While DHS emphasizes the dividend side of this approach, WTV emphasizes share buybacks. Here, we show the share reduction yield to account for how some companies may be doing big share buybacks but also, at the same time, large share issuances. Share reduction yield nets these two sides out such that there is an emphasis on capturing the impact of buybacks that are reducing a company's shares outstanding.
Source: WisdomTree, specifically data from the Fund Comparison Tool in the PATH suite of tools, accessed 1/14/25. Data is as of 12/31/24. Dividends are not guaranteed. Past performance is not indicative of future results. Investment return and principal value of an investment will fluctuate so that an investor's shares, when redeemed, may be worth more or less than their original cost. Current performance may be lower or higher than the performance data quoted. For the most recent month-end and standardized performances and to download the respective Fund prospectuses, click the relevant ticker: DGRW, DHS, QGRW, WTV.
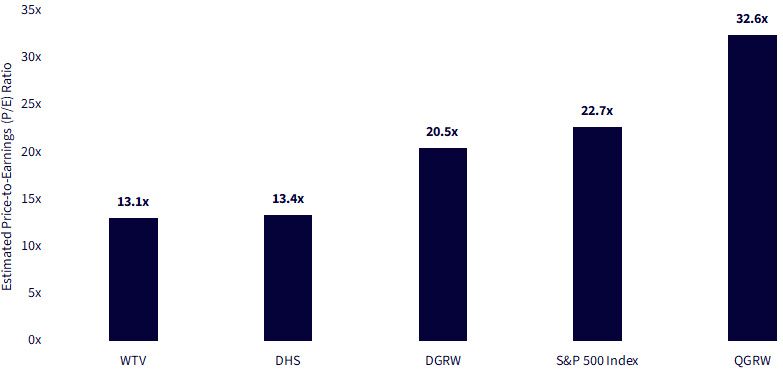
Valuation can be tricky in that while we cannot ever say it is "unimportant," at the same time, it is not moving markets on a day-to-day basis. The S&P 500 Index has an estimated P/E ratio of around 22 times expected earnings—which is not particularly high relative to history but also not particularly low.
DHS, with its estimated P/E ratio of 13.4x, is a clear outlier in the inexpensive direction, along with WTV and its estimated P/E ratio of 13.1x.
QGRW, with its estimated P/E ratio of 32.6x, is a clear outlier in the other direction.
We would simply remind investors that, for the last two years, many investors have focused on growth and future growth potential. Nvidia has been the ideal that all other companies seeking to do this can follow. That focus on growth and rewarding growth is the "why" as to "why is QGRW's estimated P/E ratio so much higher than the others?" If history is any guide, at a certain point, the expectations of future growth start to disappoint investors, and valuations drift back down to more attractive levels.
Unfortunately, valuation has historically been a terrible "timing" indicator, and we recognize that certain policies and announcements—for example, about taxation—could cause QGRW to have another banner year and push this valuation even higher.
The contrast between WTV and QGRW, visible in figure 5, is another piece of the rationale for why some investors are thinking about both of the strategies in combination.
Source: WisdomTree, specifically data from the Fund Comparison Tool in the PATH suite of tools, accessed 1/14/25. Data is as of 12/31/24.
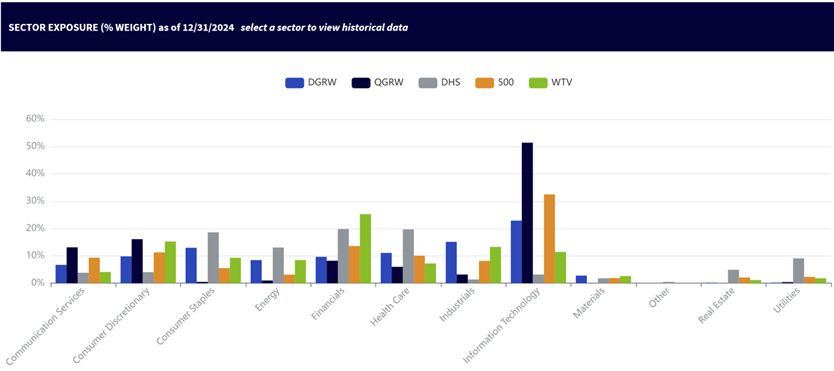
In figure 6, the sector picture further supports the positioning of the different strategies on our aforementioned spectrum.
Source: WisdomTree, specifically data from the Fund Comparison Tool in the PATH suite of tools, accessed 1/14/25. Data is as of 12/31/24.
As 2025 unfolds, the investment landscape may challenge many assumptions forged during the dominance of the "Magnificent 7." Navigating this evolving environment requires thoughtful strategy selection, and the spectrum of approaches—from the income-oriented resilience of DHS and the value-driven focus of WTV to the balanced growth and quality emphasis of DGRW and the offensive, growth-oriented potential of QGRW—offers investors tools tailored to different outlooks and risk tolerances. DHS provides the most defensive positioning for those seeking stability, while WTV, with its low valuation focus, introduces a contrarian element, appealing to those who see opportunity in cyclical rebounds or undervalued segments of the market. Meanwhile, DGRW and QGRW span the middle and growth extremes, with the latter leaning into the momentum of continued mega-cap strength. Together, these strategies illustrate the power of diversification and adaptability, empowering investors to align their portfolios with their views on what comes next. Because, if one truth endures in equity markets, it's that change is not a question of if—but when.
There are risks associated with investing, including possible loss of principal. Please read the Fund’s prospectus for specific details regarding the Fund’s risk profile.
DHS & DGRW: Funds focusing their investments on certain sectors increase their vulnerability to any single economic or regulatory development. This may result in greater share price volatility. Dividends are not guaranteed, and a company currently paying dividends may cease paying dividends at any time.
QGRW: Growth stocks, as a group, may be out of favor with the market and underperform value stocks or the overall equity market. Growth stocks are generally more sensitive to market movements than other types of stocks. The Fund is non-diversified, as a result, changes in the market value of a single security could cause greater fluctuations in the value of Fund shares than would occur in a diversified fund. The Fund invests in the securities included in, or representative of, its Index regardless of their investment merit. The Fund does not attempt to outperform its Index or take defensive positions in declining markets and the Index may not perform as intended.
WTV: Funds focusing their investments on certain sectors increase their vulnerability to any single economic or regulatory development. This may result in greater share price volatility. While the Fund is actively managed, the Fund’s investment process is expected to be heavily dependent on quantitative models and the models may not perform as intended.

Global Head of Research
Christopher Gannatti began at WisdomTree as a Research Analyst in December 2010, working directly with Jeremy Schwartz, CFA®, Director of Research. In January of 2014, he was promoted to Associate Director of Research where he was responsible to lead different groups of analysts and strategists within the broader Research team at WisdomTree. In February of 2018, Christopher was promoted to Head of Research, Europe, where he was based out of WisdomTree’s London office and was responsible for the full WisdomTree research effort within the European market, as well as supporting the UCITs platform globally. In November 2021, Christopher was promoted to Global Head of Research, now responsible for numerous communications on investment strategy globally, particularly in the thematic equity space. Christopher came to WisdomTree from Lord Abbett, where he worked for four and a half years as a Regional Consultant. He received his MBA in Quantitative Finance, Accounting, and Economics from NYU’s Stern School of Business in 2010, and he received his bachelor’s degree from Colgate University in Economics in 2006. Christopher is a holder of the Chartered Financial Analyst Designation.
