

Just How “Rich” Is U.S. Credit
Published January 22, 2025

Kevin Flanagan
Head of Investment and Fixed Income Strategy
Key Takeaways
- Investment-grade (IG) and high-yield (HY) spreads, at +80 basis points (bps) and +270 bps, respectively, approach multi-decade lows, yet periods of narrow spreads have historically persisted during stable economic conditions.
- IG and HY yields, at 5.37% and 7.34%, reflect resilience in U.S. corporates, benefiting from higher Treasury rates while remaining well above pre-pandemic levels.
- While tight spreads and increased supply pose challenges, supportive macroeconomic conditions and attractive yields justify maintaining a neutral allocation to U.S. corporate bonds.
When investors have been looking to allocate funds within the U.S. fixed income markets, credit has seemingly been viewed as being perhaps too “rich,” or expensive, in relative terms. This viewpoint has been applied to both the investment-grade (IG) and high-yield (IG) universes. In this blog post, I wanted to provide the reader with some perspective on just where U.S. corporate bonds reside from a historical basis, using spreads and yield levels.
Figure 1: Investment-Grade Spread (RS) vs. High-Yield Spread (LS)
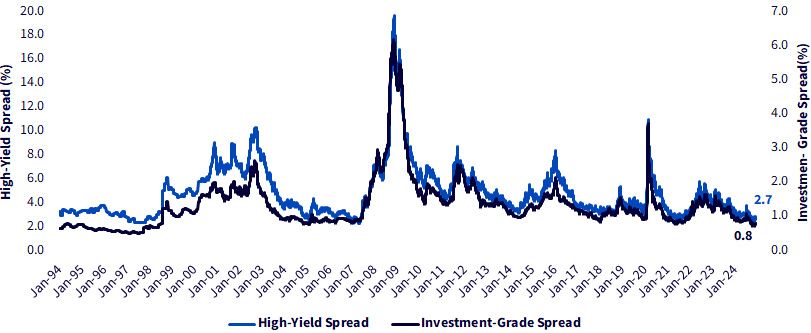
Source, Bloomberg, as of 1/17/25.
- As of this writing IG and HY spreads register at +80 basis points (bps) and +270 bps, respectively
- For IG, this is essentially the narrowest reading since 1998, while for HY, you have to go back to 2007
- For the record, the all-time lows are +51 bps (1997) for IG and +233 bps (2007) for HY
- While certainly on the tight side from a historical perspective, there have been some non-disruptive episodes where spreads have resided at rather narrow levels for a period of time:
- IG: 1994–1998, average +70 bps; 2004–2006, average +91 bps
- HY: 1996–1997, average +280 bps; 2006–6/2007, average +297 bps
- IG: 1994–1998, average +70 bps; 2004–2006, average +91 bps
- HY: 1996–1997, average +280 bps; 2006–6/2007, average +297 bps
- Macroeconomic conditions of good growth, moderating inflation and a less restrictive monetary policy from the Federal Reserve could provide continued support for U.S. corporates
Figure 2: U.S. Corporate Bond Yields
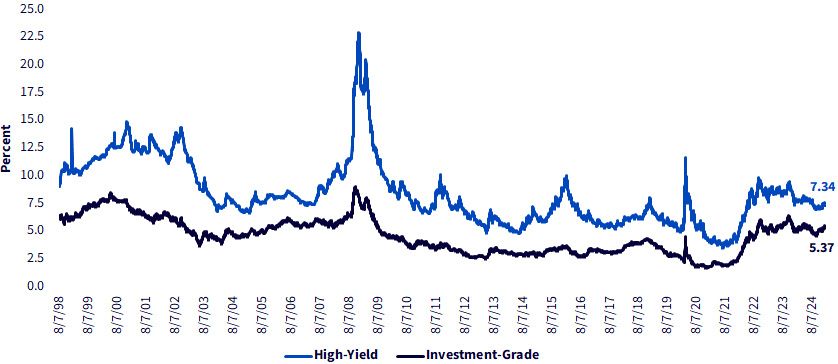
Source, Bloomberg, as of 1/17/25.
- As of this writing, IG and HY yields register at 5.37% and 7.34%, respectively
- Due to the rise in Treasury yields since mid-September, IG yields have increased nearly +75 bps, while HY yields are up almost +40 bps despite a narrowing in spreads
- While these yield levels are down from their recent high-water marks of 2022/2023, they remain well above their 2019 pre-COVID lows of 2.77% for IG and 5.09% for HY
Conclusion
From an investment perspective, potential headwinds such as historically tight spreads and an increase in upcoming supply could be offset by the combination of supportive forces like macro/Fed factors and elevated yield levels. As a result, we would rate U.S. corporates as neutral in terms of fixed income asset allocation.
Categories

About the contributor

Kevin Flanagan
Head of Investment and Fixed Income Strategy
Kevin serves as the Head of Investment and Fixed Income Strategy. In this role, he writes macro and fixed income-related content and works closely with the sales, research and marketing teams. In addition, Kevin conducts client-facing webinars and meetings, providing expertise on WisdomTree’s existing and future bond ETFs. Prior to joining WisdomTree, Kevin spent 30 years at Morgan Stanley, where he was Managing Director and Chief Fixed Income Strategist for Wealth Management. He was responsible for tactical and strategic recommendations and created asset allocation models for fixed income securities. He was a contributor to the Morgan Stanley Wealth Management Global Investment Committee, primary author of Morgan Stanley Wealth Management’s monthly and weekly fixed income publications, and collaborated with the firm’s Research and Consulting Group Divisions to build ETF and fund manager asset allocation models. Kevin has an MBA from Pace University’s Lubin Graduate School of Business, and a B.S. in Finance from Fairfield University.