

Five Alive: Where Is the Treasury 10-Year Yield Headed?
Published January 8, 2025

Kevin Flanagan
Head of Investment and Fixed Income Strategy
Key Takeaways
- The U.S. Treasury (UST) 10-year yield could trend toward 5% in 2025, supported by a combination of historical averages and a steepening Treasury yield curve.
- While inflation improvements remain uneven, we believe the Federal Reserve’s (Fed) path of modest rate cuts and economic resilience creates a conducive environment for elevated yields.
- Investors should monitor the spread between the Fed Funds Rate and the UST 10-Year yield, which historically averages +130 basis points (bps), as a key indicator for potential moves in long-term Treasury rates.
Listen to the accompanying episode of the Basis Points podcast:
With a return to a normal U.S. interest rate setting, the most obvious question that comes to mind is: Where is the UST 10-Year yield headed? As we enter 2025, there has been a lot of conjecture about a return to the 5% threshold. Against this backdrop, I thought it would be a useful exercise to provide the reader with some perspective, and what I feel investors should be looking for in the year ahead.
In my opinion, when trying to determine where yields may be going, one should start at the cornerstone for rates—the macro/Fed landscape. Our baseline case looks for the U.S. economy to continue on a modest/moderate growth path, with further improvement on the inflation front proving to be "bumpy," to borrow Fed Chair Powell's description. These two forces have now put the Fed on a path for only two more rate cuts in 2025, based on the December Federal Open Market Committee (FOMC) dot plot.
Post-election, the money and bond markets have been trying to also determine how upcoming fiscal policy will fit into the equation. However, this aspect and its potential attendant impact on rates carries more uncertainty. While tariffs can arguably be more easily and quickly implemented, any legislative initiatives take more time and may not be "in the books" until after mid-year, at the earliest. Figure 1 shows the historical trends of the U.S. Treasury 10-Year yield over the past 30 years.
Figure 1: U.S. Treasury 10-Year Yield
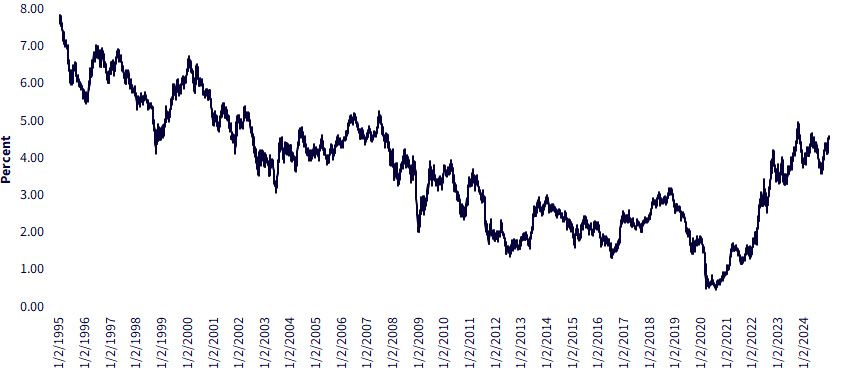
Source, Bloomberg, as of 12/30/24.
Against this backdrop, let's go back to the macro/Fed setting and also look at history for some guidance. Let me ask you a question after you look at the above graph: What is the outlier here? Sure, you could go back to 1995–1997 and, say, 6%–8% yields, but I zoom in on the 2008-to-late-2022 period, when the yield fell below 4% during the financial crisis/great recession and ultimately plummeted to a pandemic-low of 0.50% before beginning its ascent to where we are today. Figure 2 compares the Fed Funds Rate with the U.S. Treasury 10-Year yield.
Figure 2: Fed Funds vs. UST 10-Year Yield
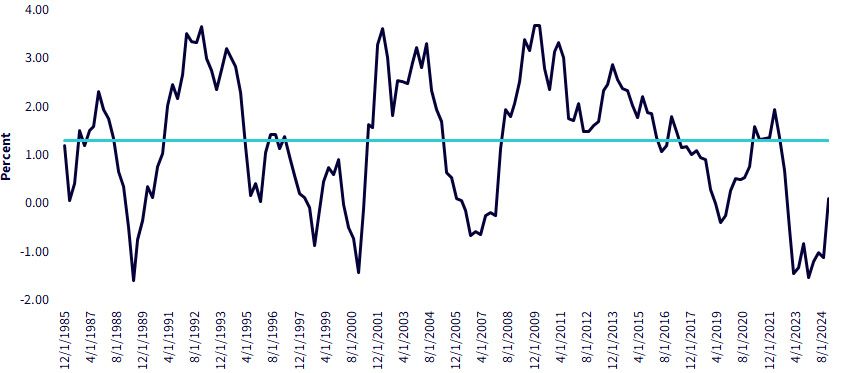
Source, Bloomberg, as of 12/30/24.
I would argue those two periods are the outliers and that what lies in between is a trading range of roughly 4%–5%. Not only is the macro/Fed backdrop conducive for this trading band, but history once again can teach us a lesson, specifically looking at the spread between the Fed Funds Rate and the UST 10-Year yield. The long-run average of this measure stands at about +130 bps—the UST 10-Year yield is higher than the rate for overnight money.
Investors have recently witnessed the Treasury yield curve un-inverting and moving back into positive territory. In fact, as of this writing, the Fed Funds/UST 10-Year spread came in at +17 bps. Based on the FOMC's December Summary of Economic Projections (SEP), the median estimate is for Fed Funds to drop to 3.90% in 2025. If the curve continues to steepen in the new year—our base case expectation—and gravitates toward its long-run average, the math tells us that the UST 10-Year yield could be poised to reach the 5% threshold, if not actually a touch above.
Conclusion
After the December FOMC meeting, the UST 20- and 30-Year yields have already reached high watermarks of 4.90% and 4.82%, respectively. Perhaps the UST 10-Year will join the parade, where ultimately, the longest end of the Treasury yield curve all trades at, or above 5%, in 2025.

About the contributor

Kevin Flanagan
Head of Investment and Fixed Income Strategy
Kevin serves as the Head of Investment and Fixed Income Strategy. In this role, he writes macro and fixed income-related content and works closely with the sales, research and marketing teams. In addition, Kevin conducts client-facing webinars and meetings, providing expertise on WisdomTree’s existing and future bond ETFs. Prior to joining WisdomTree, Kevin spent 30 years at Morgan Stanley, where he was Managing Director and Chief Fixed Income Strategist for Wealth Management. He was responsible for tactical and strategic recommendations and created asset allocation models for fixed income securities. He was a contributor to the Morgan Stanley Wealth Management Global Investment Committee, primary author of Morgan Stanley Wealth Management’s monthly and weekly fixed income publications, and collaborated with the firm’s Research and Consulting Group Divisions to build ETF and fund manager asset allocation models. Kevin has an MBA from Pace University’s Lubin Graduate School of Business, and a B.S. in Finance from Fairfield University.