
Why Do We Care about Market Volatility?


This article is relevant to financial professionals who are considering offering Model Portfolios to their clients. If you are an individual investor interested in WisdomTree ETF Model Portfolios, please inquire with your financial professional. Not all financial professionals have access to these Model Portfolios.
One of the overarching themes we are emphasizing for the markets in 2023 is a continuation of the elevated volatility quotient. Typically, heightened volatility is a by-product of uncertainty as the markets try to grapple with the probabilities of upcoming events. To be sure, uncertainty is arguably the worst fear of any investor.
The primary culprit in 2022, and for this year up to now, has been the Fed and the evolution of their policy-making decisions. What was once thought of as a deliberative rate hike approach gave way to a ‘Volcker-esque’ tightening cycle that hadn’t been witnessed since the 1980s. Unfortunately, clarity on the Fed tightening front does not appear to be forthcoming any time soon. Chairman Powell’s semiannual monetary policy testimony only added to the uncertainty currently within the market psyche. But that was for more normal fundamental conditions. Now, with the headlines surrounding the Silicon Valley Bank (SVB) and Signature Bank (SBNY) failures, a whole new layer has been added.
As a result, market volatility in arenas such as the U.S. Treasury market is at its highest level since 2008! Against this backdrop, we thought it would be useful to take a deeper dive on the volatility front.
First, we need to define the two most frequently referenced measures of market volatility—the VIX equity volatility index and the MOVE bond volatility index.
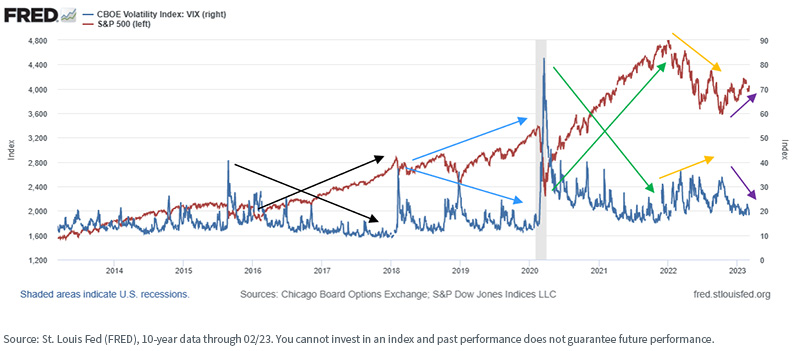
CBOE Volatility Index (VIX): This is the most widely tracked and reported equity market volatility index. It is a real-time index that represents the market’s expectations for the relative strength of near-term price changes of the S&P 500 Index. It is derived from the prices of 30-day forward S&P 500 Index options. As such, it generates a 30-day forward projection of volatility. Volatility can be seen as a way of evaluating current investor sentiment, either complacency (low VIX levels) or fear (high VIX levels).
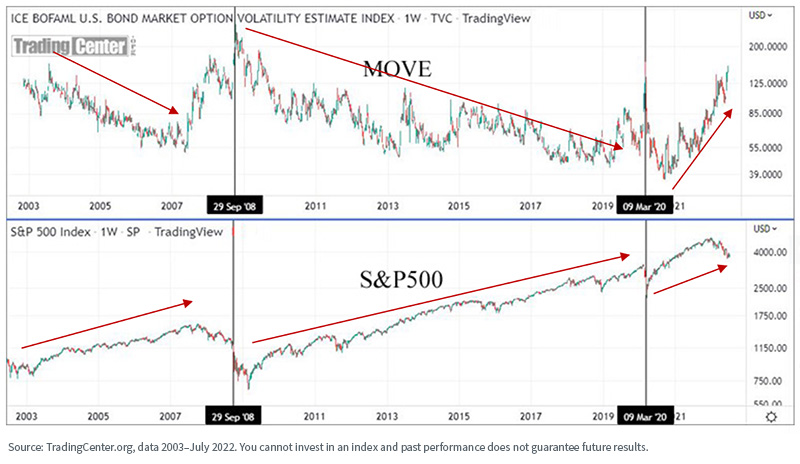
ICE MOVE Index (MOVE): This is a measure of interest rate volatility, and tracks movements in U.S. Treasury yield volatility implied by the current prices of one-month over-the-counter (OTC) options. The measured volatility is based on 2-Year, 5-Year, 10-Year and 30-Year U.S. Treasuries.
Why do we care about these volatility measures? One reason is that most long-only equity investment products and strategies have an inherent short volatility profile. That is, they tend to fall in price when volatility rises (conversely, frequently used hedging strategies, such as long put options, almost definitionally have a long volatility profile—they go up in value when volatility goes up).
We can see this inverse relationship between the equity market and the VIX by examining the track records of each. We’ve tried to make this chart easier to interpret by using different colored arrows to mark different market regimes.
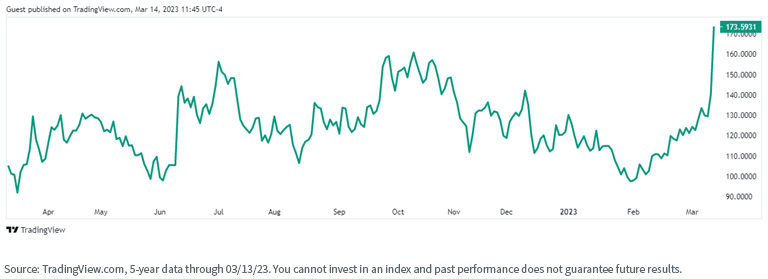
What is perhaps more interesting is the relationship between the S&P 500 and the MOVE. We see a similar relationship between the two as with the VIX—the S&P 500 tends to go up as MOVE goes down—until March 2020 (the onset of COVID), when we see a rapid rise in MOVE but a corresponding rise in the S&P 500. This is at least partially explained by the fact that the volatility in the MOVE was caused by rates falling, which typically is good for stocks, especially the tech-heavy S&P 500.
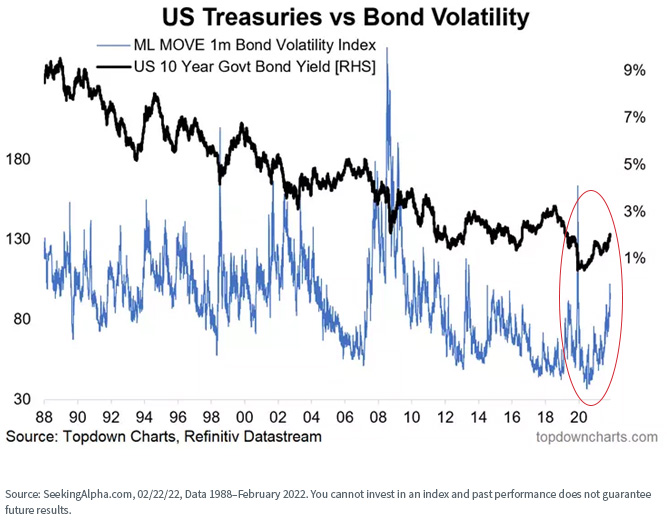
Now let’s look at the relationship between MOVE and the 10-Year Treasury yield. Given the generalized downward trend in rates between roughly mid-1981 and mid-2020 (the “great bond bull rally”), we might not expect to see much relationship between the two—and we don’t, though steep increases in MOVE do seem to correspond to steep declines in yields. But as rates began to rise again in 2020, the relationship seemingly has become much tighter.
There seems to be a stronger relationship between the MOVE and credit spreads, specifically corporate and mortgage-backed securities (MBS).
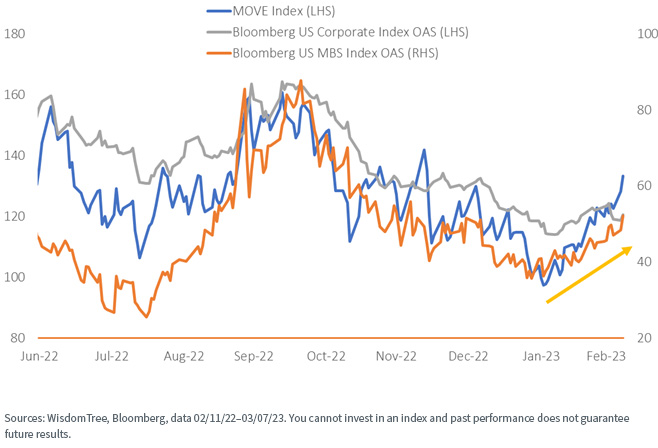
For definitions of terms in the chart above please visit the glossary.
Now let’s look at the more recent movement in the MOVE. The onset of COVID in March 2020 resulted in a huge upswing in the index followed by an equally dramatic decline as the market realized the world wasn’t going to end. Since roughly July 2020, we’ve seen a steady increase (and also an increase in the volatility of the index itself) that we believe is caused by an increased focus by bond investors on the actions and pronouncements of the Fed as it first fought COVID and then rising inflation. Note the steep increase over the past month or so as the market reacted to a seemingly persistent hawkish tone from the Fed and then, most recently, the failures of SVB and SBNY—respectively the second- and third-largest bank failures in U.S. history.
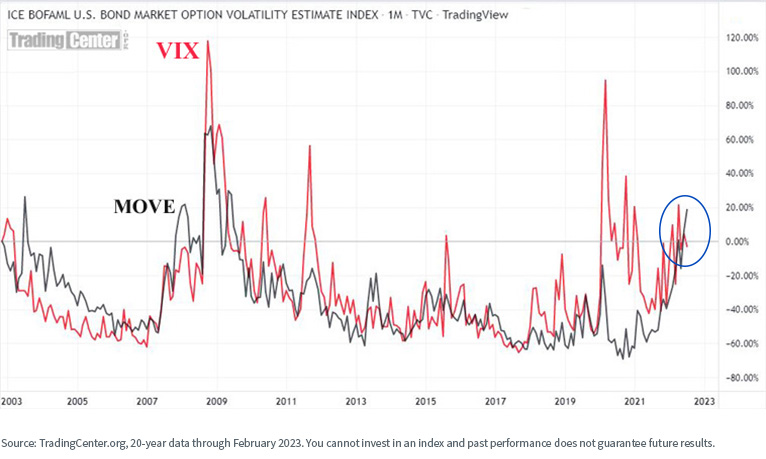
What about the relationship between the MOVE and the VIX? From a longer-term perspective, they seem highly correlated, which we might intuit from their seemingly similar relationships with the S&P 500, as illustrated above.
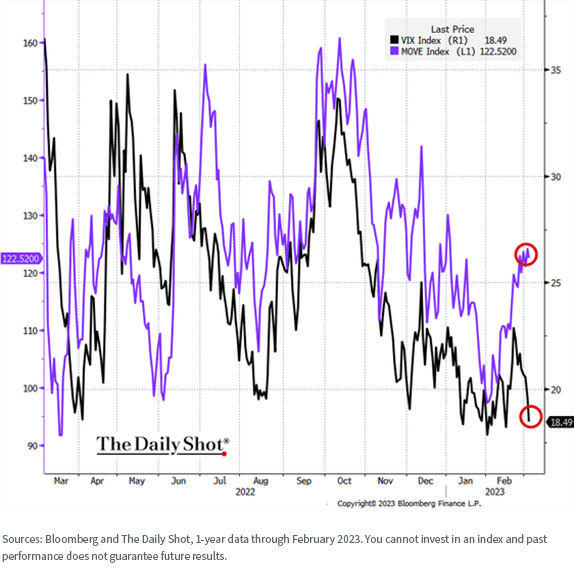
But if we zero in on more recent performance (barely visible at the far right of the previous graph), we see something interesting—an uncoupling of the two metrics since roughly February of this year.
So, Remind Me Again Why We Care?
1. As the above charts suggest, stock and bond volatility metrics are solid concurrent (and perhaps even slightly leading) indicators of investor sentiment and market momentum.
2. Both the VIX and the MOVE seem to have generally inverse relationships to the performance of the S&P, so an increase in either (or both) might be viewed as a potential bearish market signal.
3. The recent decoupling of the VIX and MOVE, compared to the much longer-term similarity between the two, suggests an eventual mean-reversion—either bond volatility will fall or equity market volatility will rise, or some combination of the two. Given continued uncertainty over inflation, the economy and Fed actions, we see it as more likely the VIX will rise (despite the recent spike in the MOVE following the failures of SVB and SBNY)—perhaps another bearish signal for equities.
4. The relationship between the increasing MOVE and credit spreads may suggest that spreads will widen as we move forward.
5. One characteristic of many WisdomTree products and most of our Model Portfolios is an anchoring to the quality factor—companies and strategies that exhibit better balance sheets, earnings, cash flow and dividend sustainability. How does this relate to volatility?
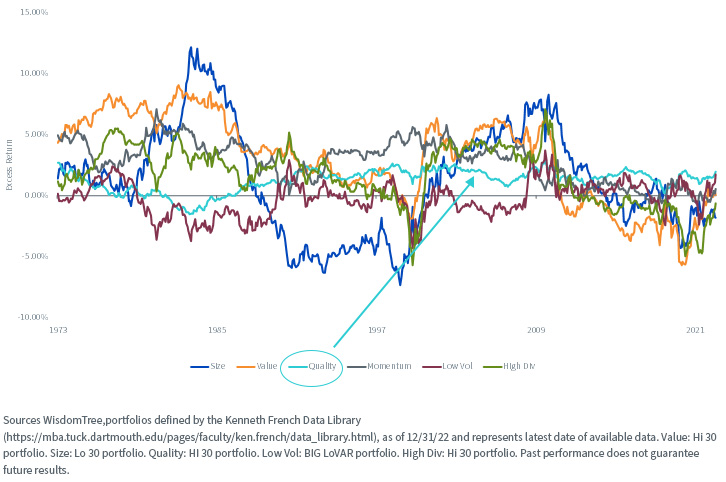
In comparison to other risk factors we might examine, the quality factor has proven to be the most consistent—it is rarely either the best or worst performing factor over full market cycles. So, by using quality as an anchor factor tilt, we believe we can improve the consistency of performance, regardless of the volatility regime. Focus on the teal-colored line in the chart below.
Rolling 10-Year Excess Return vs. Market
Conclusion
Understanding market volatility, as measured by the VIX and the MOVE, can be useful in forming a market view and positioning portfolios accordingly. Current indications suggest we may be in for a more volatile market environment as we move through 2023.
We will never apologize for being ’over-weight’ quality in our products and Models—we believe it can help improve performance consistency, regardless of market regime. If we are correct in our view of volatility trends this year, we believe it will help us weather the storm.
You can learn more about our Model Portfolios on the WisdomTree Model Adoption Center.
At the product level, the WisdomTree Floating Rate Treasury Fund (USFR) is a potential solution which may help take advantage of the higher yields in the Treasury market without the volatility associated with fixed coupon issues.Important Risks Related to this Article
There are risks associated with investing, including possible loss of principal. Securities with floating rates can be less sensitive to interest rate changes than securities with fixed interest rates, but may decline in value. The issuance of floating rate notes by the U.S. Treasury is new and the amount of supply will be limited. Fixed income securities will normally decline in value as interest rates rise. The value of an investment in the Fund may change quickly and without warning in response to issuer or counterparty defaults and changes in the credit ratings of the Fund’s portfolio investments. Due to the investment strategy of this Fund it may make higher capital gain distributions than other ETFs. Please read the Fund’s prospectus for specific details regarding the Fund’s risk profile.Share & Comment
Popular Posts
Categories
Related Links