
Is a 4% Treasury 10-Year Yield Possible?


With the Fed ramping up its rate hikes, investors are wondering where this will all end. Certainly, Powell & Co. have been moving the goalposts in that regard, with their latest dot plot revealing a median terminal Federal Funds Rate target of 3.80% in 2023, a full percentage point from what was estimated in March. This has become a moving target, which makes projecting where the U.S. Treasury (UST) 10-Year yield may end up a challenging endeavor.
While the overarching trend thus far in 2022 has been for the UST 10-Year yield to move to the upside, recent trading action has underscored the volatile nature of the bond market. After approaching 3.20% in early May, the 10-Year quickly reversed course and fell nearly 50 basis points (bps) toward the end of the month, to just above 2.70%. Then, last week investors witnessed a renewed surge northward, as the yield was knocking on the door of 3.50%.
U.S. 10-Year Fibonacci Chart
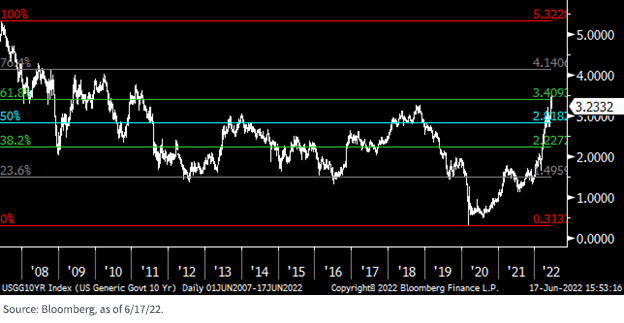
Naturally, the question remains whether a top has been reached. However, after looking at technical analysis, the rise in the UST 10-Year yield may not be over just yet. According to the closely followed Fibonacci retracement levels, this most recent move to the upside broke through the longer-term level of roughly 3.41%. As the enclosed graph reveals, there is now nothing between this aforementioned reading and the next retracement level of 4.14%.
Now, I’m not projecting that the 10-Year is about to break through the 4% barrier at this time. But the lack of any support levels before this threshold does create quite the conundrum. As we’ve discussed in some prior blog posts, watching developments from a real yield perspective could help determine where the nominal UST 10-Year yield could go as well. Thus far, it has worked quite well. During the current run-up of close to 3.50%, the 10-Year Treasury Inflation-Protected Securities (TIPS) yield surged by 75 bps, or nearly identical to the increase for the UST 10-Year. In fact, after being in the negative column as recently as late April, the 10-Year TIPS yield rose to as high as 0.83% before settling in at 0.64% as of this writing. Interestingly, this yield is still about 50 bps below the peak registered in 2018 during the last Fed rate hike cycle.
Conclusion
Barring a collapse in the economic data or a stock market meltdown, investors may look to the technicals and real yields for guidance on where that elusive top will be for the UST 10-Year yield. In my opinion, another test and potential overshoot of the 3.50% level seems distinctly possible.
Share & Comment
Popular Posts
Categories
Related Links