
You Can’t Always Get What You Want


I saw her today at the reception
A glass of wine in her hand
I knew she would meet her connection
At her feet was her footloose man
No, you can’t always get what you want
You can’t always get what you want
You can’t always get what you want
But if you try sometime you find
You get what you need…
To get my fair share of abuse
Singing, “We’re gonna vent our frustration
If we don’t we’re gonna blow a fifty-amp fuse”
You can’t always get what you want
You can’t always get what you want
You can’t always get what you want
But if you try sometimes, well, you just might find
You get what you need…
(From “You Can’t Always Get What You Want” by The Rolling Stones, 1968)
In today’s politicized environment, many people might interpret this blog post’s title as a reference to the election—there are, for sure, many people who did not get the outcome they wanted. Only time will tell if it is the outcome they need.
And we certainly have witnessed plenty of people “venting their frustration” before they “blow a fifty-amp fuse”!
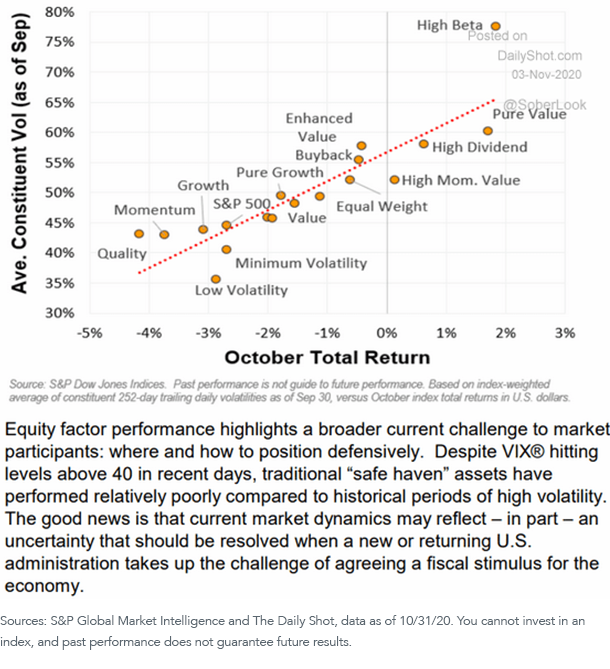
But from an investment perspective, we want to reference this song in the context of factor investing. Here are a couple of interesting charts showing the absolute and relative performances and volatility of different S&P 500 risk factors relative to the broad S&P 500 Index:
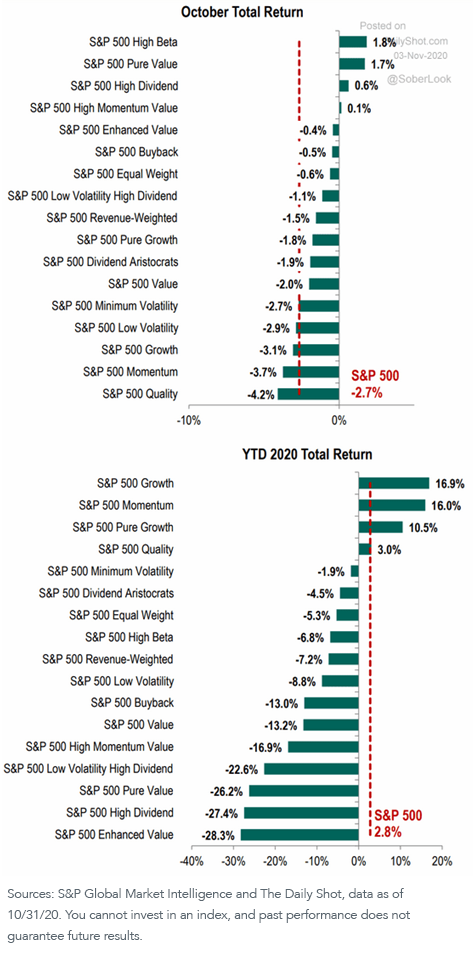
For definitions of terms in the chart, please visit our glossary.
If we “open the aperture” on our time horizons, we see some further interesting results. We will focus on five of the most commonly followed risk factors—growth, value, dividends, momentum and quality—and compare their performances relative to the corresponding broad market Index (the S&P 500). We will first examine total return performances over the longest common investment period (i.e., since 2016). These charts are somewhat “busy,” but we think illustrative:
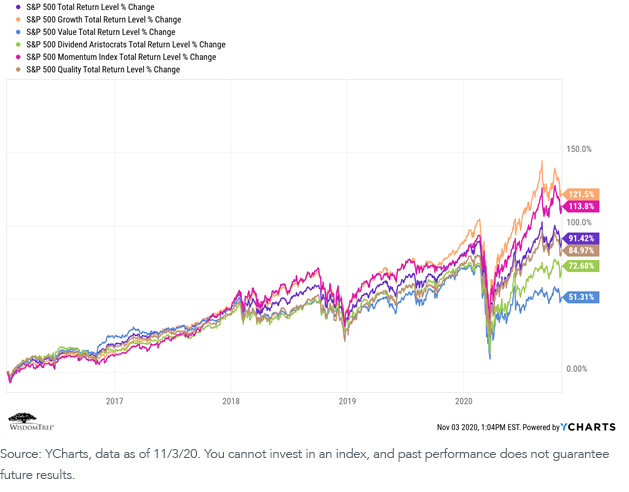
No surprise, growth (orange) and momentum (magenta) have dominated performance since 2016, while dividends (green) and value (blue) have trailed the pack.
But let’s take a look at the same chart since the beginning of the third quarter (which we use as a proxy for the onset of the current economic recovery after the pandemic-induced recession of the first two quarters):
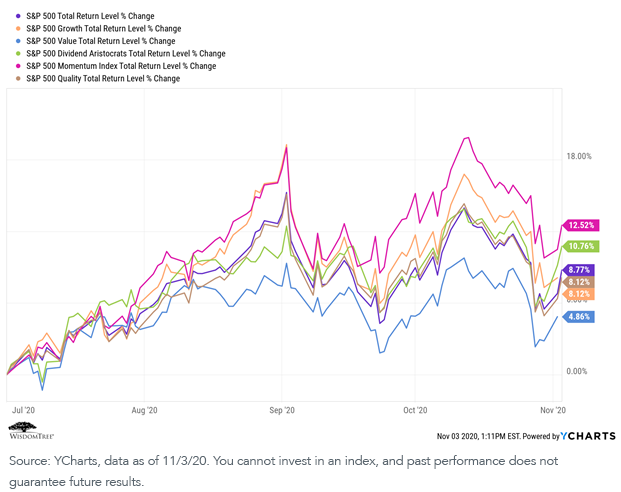
While momentum continues to lead the way, note that we also see a distinct factor rotation away from growth (due at least partially to extended valuations for that factor) and toward dividends.
Value continues to trail, and we’ve addressed that issue in several previous blog posts, most recently in “I’m Still Standing.” We haven’t given up hope that its day will come.
But we want to make two broader points. First, we do believe that factors rotate in and out of favor as economic and market regimes change. This is captured nicely in this illustrative graph from O’Shaughnessy Asset Management (OSAM):
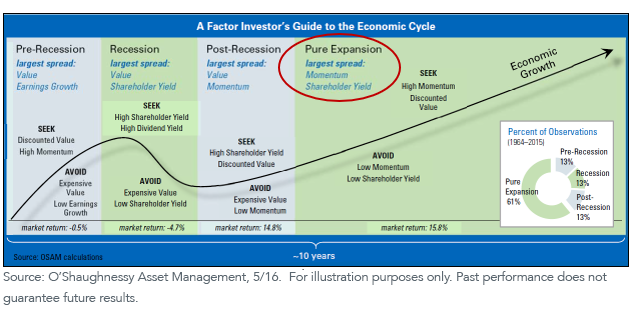
Without belaboring the point, one could reasonably argue that the market has priced in a new (and massive) fiscal stimulus package and is therefore anticipating a renewed “pure expansion” economic phase. This may at least partially explain why momentum and yield (dividends) have become the current market-leading factors.
A quick side note on the quality factor. In none of the above charts does quality “lead the way” as a driver of performance. But, as noted in the OSAM paper cited above:
The Quality themes of Financial Strength, Earnings Quality, and Earnings Growth tend to offer lower excess return in the high deciles but interact well with the other selection themes [factors] when the low deciles are avoided.
In other words, while the quality factor by itself typically will not drive performance, a quality “overlay” onto the other factors can help improve the performance of those factors by screening out lower quality securities that may not have sustainable performance drivers.
This aligns extremely well with the WisdomTree investment philosophy. While we do not manage an explicit quality factor index, we do apply proprietary quality screens to many, if not most, of our ETF solutions. We strongly believe this improves the potential for enhanced performance and sustainability of the other factors.
Second, we have written before about the benefits of risk factor diversification. Here is a chart we use frequently to illustrate the rotating nature of various WisdomTree factor performances:
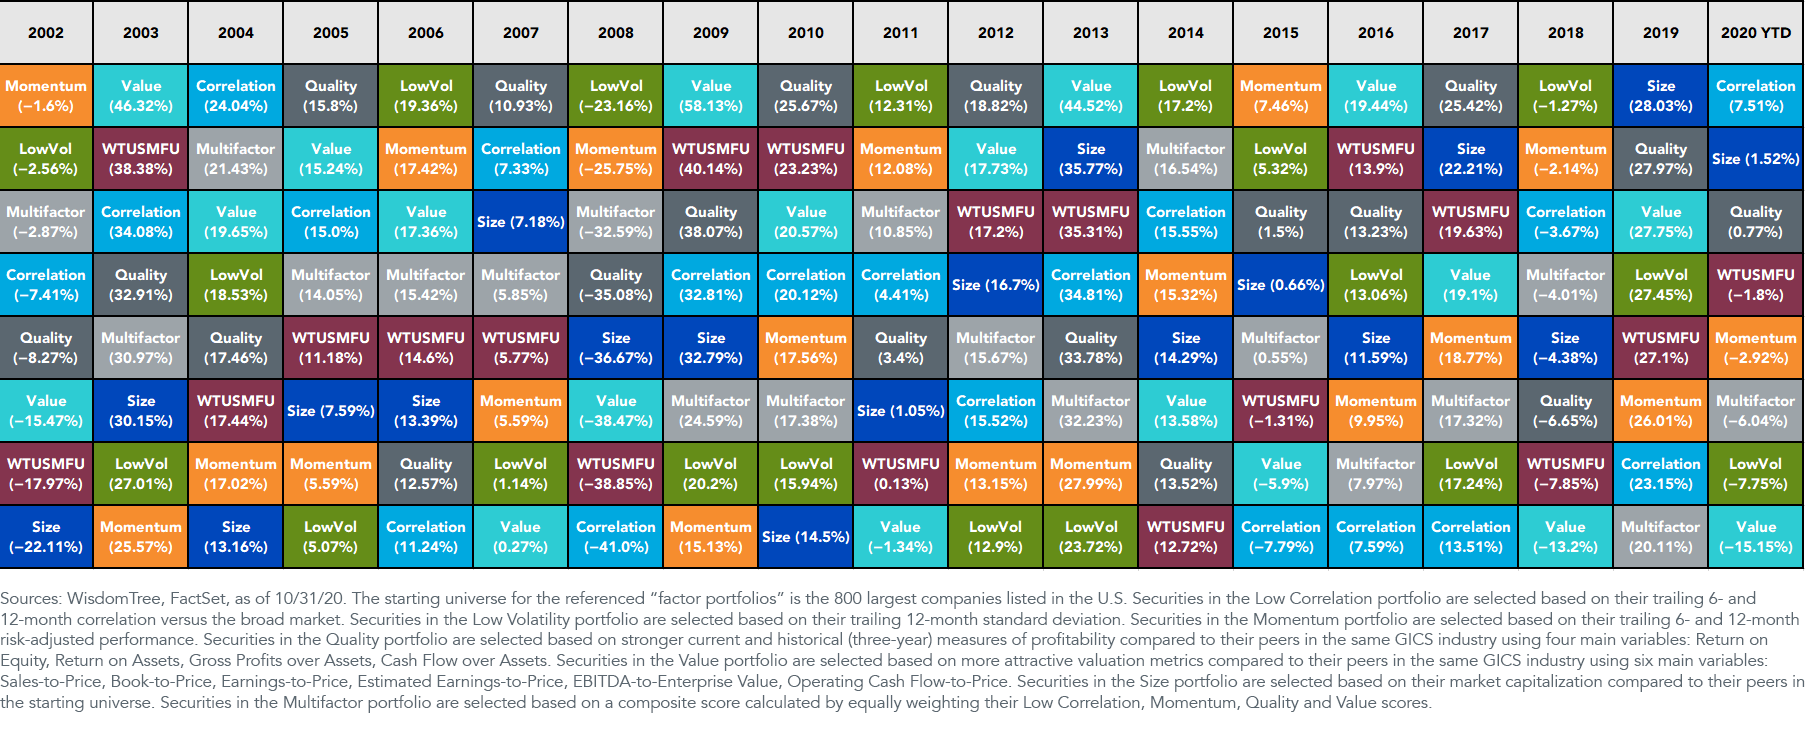
It is exactly because of this factor rotation that all WisdomTree Model Portfolios (which are available only through financial advisors) are diversified at both the asset class level and the risk factor level. We believe this improves the overall diversification of our Model Portfolios and, therefore, has the potential to improve performance consistency over full market cycles.
Trying to outguess the market is, in the end, a fool’s game. We believe a better approach is to build strategic “all-weather” portfolios that can handle whatever comes their way over full market cycles.
You may not always get what you want, but in the end, we believe you will have a better chance of getting what you need.
1Ehren Stanhope, CFA, “The Economic Cycle: A Factor Investor’s Perspective,” O’Shaughnessy Asset Management, May 2016. (https://www.osam.com/pdfs/research/_22_Commentary_TheEconomicCycle-AFactorInvestorsPerspective_May-2016.pdf)
Important Risks Related to this Article
Diversification does not eliminate the risk of experiencing investment losses.
Share & Comment
Popular Posts
Categories
Related Links