
Dividend Safety and Valuations


We recently highlighted a few of the trends we’re closely following for U.S. dividends. Among them, significant cuts anticipated by futures with disparity in sell-side forecasts.
WisdomTree maintains eight U.S. dividend indexes across market caps, high-dividend yield and dividend growth. Assessing dividend safety and valuations across these indexes yields unique insights on the uneven impact of cuts and suspensions across markets.
Broad Market—Cuts Are Sector-Specific
WisdomTree’s broadest dividend index—the WisdomTree U.S. Dividend Index—holds about 1,400 companies that pay regular cash dividends. It’s a similar universe to the approximately 1,500 securities in the total market Russell 3000 Index that pay a dividend.
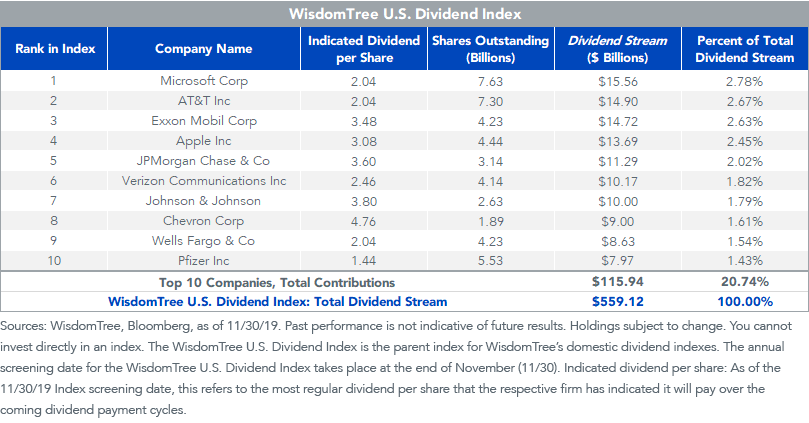
As of the December 2019 annual reconstitution of WisdomTree’s domestic dividend indexes, the total Dividend Stream®—the sum of all regular cash dividends—was $559 billion.
The table below illustrates the weighting process for the top 10 weights. With a Dividend Stream of $15.56 billion, Microsoft earned the greatest weight at 2.78%.
WisdomTree U.S. Dividend Index
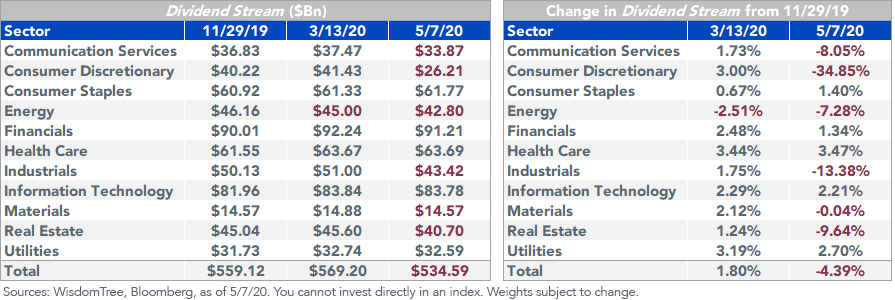
The breadth of this Index—holding all dividend payers across market caps—provides a good proxy for changes to total U.S. dividends. The combined impact of dividend reductions and dividend growth has resulted in a drop of about 4% in U.S. dividends.
The tables below show the Dividend Stream by sector on the left and the rates of change on the right. The dates represent the Index screening date (11/29/19), an unofficial peak dividends date (3/13/20) and the most recent close of business date (5/7/20).
Red font indicates a reduction in indicated dividends for that sector or index since November 29, 2019. Just greater than half of sectors (6 out of 11) have had reductions this year, and Health Care, Utilities, and Information Technology have grown dividends more than 2%.
WisdomTree U.S. Dividend Index
High-Dividend Yield and Quality Dividend Growth
The WisdomTree U.S. High Dividend Index and the WisdomTree U.S. Quality Dividend Growth Index are subsets of this broad dividend index.
The high-dividend index tracks the 30% of highest yielding companies—screening companies and adjusting weights based on a composite risk filter—and the dividend-growth index tracks 300 companies with sustainable dividends and robust profits.
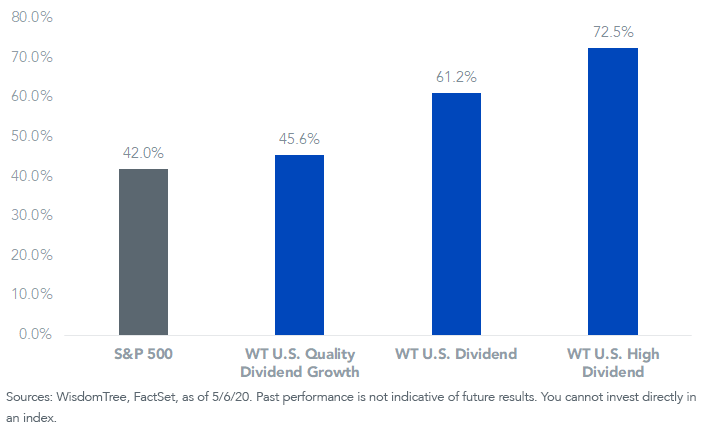
Expectations for historic dividend cuts have led the dividend-growth index to outperform the high-dividend index so far this year. Investors have wagered that the forced shutdown of the economy will cause the highest dividend yielders—typically sought after for their safety during drawdowns—to severely cut their dividends.
The dividend payout ratio chart below helps illustrate why investors perceive quality dividend growers to have safer dividends than high-yield—lower payout ratios indicate these companies can withstand a greater hit to earnings before cutting dividends.
Index Dividend Payout Ratios
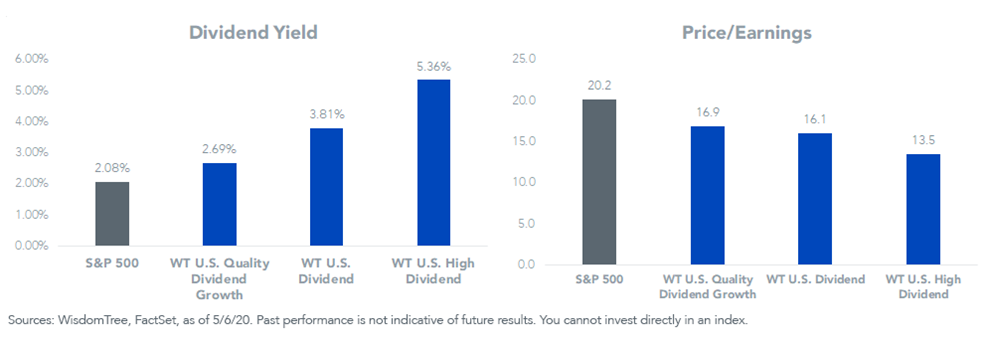
The inverse can be seen in valuations of these indexes—the high-yield index is at a significant valuation discount to the dividend-growth index. While safer, or more sustainable, dividends can be found from the quality dividend-growth index, the trailing 12-month dividend yield for high dividends is at a 10-year high.
Index Valuations
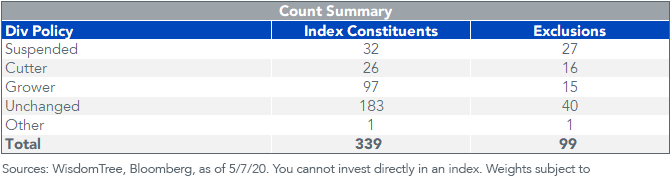
Interestingly, outsized cuts have not been witnessed from the high-dividend index thus far. This past December, an enhancement was made to the methodology to screen out companies at risk of cutting their dividends.
Of the 99 companies that were screened out (exclusions), 43 have cut or suspended their dividends. This rate (43%) is more than two times greater than the 17% of companies included in the Index that have cut or suspended their dividends.
Of companies included in the high-dividend index, 29% have grown their dividends while roughly half as many (15%) of the companies excluded have increased payouts.
WisdomTree U.S. High Dividend Index
What’s Next
Investors should expect further dividend cuts to come over the coming weeks and quarters. The greatest cuts are likely to come from the companies with the highest yields, with fewer cuts from dividend growers. But this information seems fully reflected in market prices, as we saw with discounted valuations from our high-yield index.
In a future post, we will provide an update on dividend cuts and suspensions within mid-caps and small caps, which have seen more severe cuts thus far and have also yet to experience the same recovery in their share prices that have occurred in large caps. Positioning for an eventual rebound, we think mid- and small-cap valuations may pose a historic opportunity for long-term strategic investors.
Share & Comment
Popular Posts
Categories
Related Links