
Don’t Know Much About History


When I was thinking of a title for this blog, I thought I could either go for an oldie but goodie or evoke a wilder tone with “going off the rails on a crazy train.” Alas, I was never a big Ozzy fan, so you got the oldie but goodie! Last week—the last two, actually—are perhaps better described by Mr. Osbourne, so I wanted to give you all some perspective on the latest inverted yield curve hysteria. I’m going to provide some comparisons of the last Treasury (UST) 2s/10s inversion from December 2005–June 2007 to the current episode.
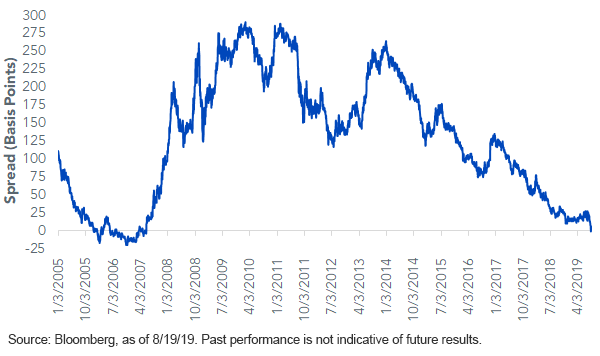
U.S. Treasury 2-Year vs. 10-Year
- Technically, the 2s/10s curve did not invert last week, at least on a closing basis. The inversion actually took place intra-day for a couple hours and one or two basis points (bps), at most. I know this may seem too technical for people, but given all the hubbub it caused, some perspective is in order, don’t you think?
- I am a student of history, so the phrase, “those who don’t learn from history are doomed to repeat it,” certainly resonates with me. Also, given the longer and wider inversions for the two other spreads, UST 3mo/10yr and UST 2s/5s, I don’t take what happened last week lightly, by any means, as a possible harbinger for what could come 9, 12, 24 months from now—a recession.
- Back to the comps… Peak 2s/10s inversion in the 2005–2007 episode was -19 bps versus -1.7 bps thus far (more on this point later). Interestingly, the spread has widened to +9 bps as I write this, the same level it was prior to last week.
- The previous episode had the Fed RAISING RATES four times while the inversion was already in place to a tune of 100 bps and a level of 5.25%. Currently, the Fed CUT RATES before the inversion took place by 25 bps to 2.25%. If my math is correct, that’s a 300-bps difference in the Fed Funds target.
- Also, the Fed just ended quantitative tightening (QT) and will be keeping their UST and MBS holdings at $3.6 trillion versus a total of “only” $750-$800 billion last time around.
- Negative yields abound… You’ve heard the reports of trillions in global bonds being in negative yield territory. In the 2005–2007 period, 10-year bunds averaged a yield of 3.91%, now they are just below -0.70%.
- Term premiums have vanished, and flight-to-quality flows are definitely playing a role in depressing longer-dated UST yields.
- Digging through recession probability indicators, one finds that they tend to be skewed to the upside if the yield curve is included, but when this aspect is excluded and the focus is on more economic variables, the probability number drops rather visibly.
- Also, another important but overlooked point is tahat, in past inversions, UST yields were rising, not falling!
Conclusion
Back to a point made earlier: I’m leaning in the direction that a 2s/10s inversion will need to be deeper/wider than past experiences to have the usual predictive value given a lot of the factors I already mentioned.
Unless otherwise stated, all data sourced is Bloomberg, as of August 19, 2019.
Share & Comment
Popular Posts
Categories
Related Links