
Do(n’t) Discount Dividend Payers


–Jeremy Siegel, Stocks for the Long Run1
The relationship between earnings and dividends is simple and important. Earnings dictate how much of a dividend companies can currently distribute to shareholders, and how much that dividend can grow over time.
These two variables, dividend per share (D1) and implied dividend growth (g), are central to the Gordon Growth Model (GGM) for valuing stocks:
V0 = D1/(k - g)
V0 = value of common stock at time 0 (i.e., today’s stock price)
D1 = dividend per share at time 1 (i.e., next year’s dividend)
k = required rate of return (i.e., discount rate on equity)
g = implied dividend growth rate (i.e., sustainable dividend growth)
The relationship between earnings and dividend growth is summed up in the equation below, which uses return on equity (ROE) as the measure of earnings. Earnings retention tells us what percentage of earnings is being plowed back into the company rather than paid out in dividends:
ROE x Earnings Retention = Implied Dividend Growth Rate (g)
If we assume a constant earnings retention—a fair assumption when looking at companies in the aggregate—ROE is the key input to the implied dividend growth rate.
WisdomTree set out to incorporate this theory into screening and weighting securities in its innovative Quality Dividend Growth family.
Companies are screened on earnings (quality), both trailing earnings and earnings growth estimates, and then weighted by their cash dividends.
To summarize the logic and objective behind the methodology:
- Logic: Using inputs commonly used by active managers and academics for valuation to construct a trackable Index in a repeatable, rules-based fashion.
- Objective: Creating a more mean-variant efficient portfolio than a market cap-weighted approach, while typically offering a lower expense ratio and more consistent investment style than a high-cost active manager who may be subject to behavioral biases and style drift.
From Theory to Practice
Valuing companies based on dividends—taught in Finance 101 courses—is well-documented and understood. In practice, though, this theory has been stressed over the last decade.
Many of the best performing large-cap U.S. stocks over the past 10 years pay no dividends at all. And for many of these companies, this is despite having high profitability and hefty cash balances.
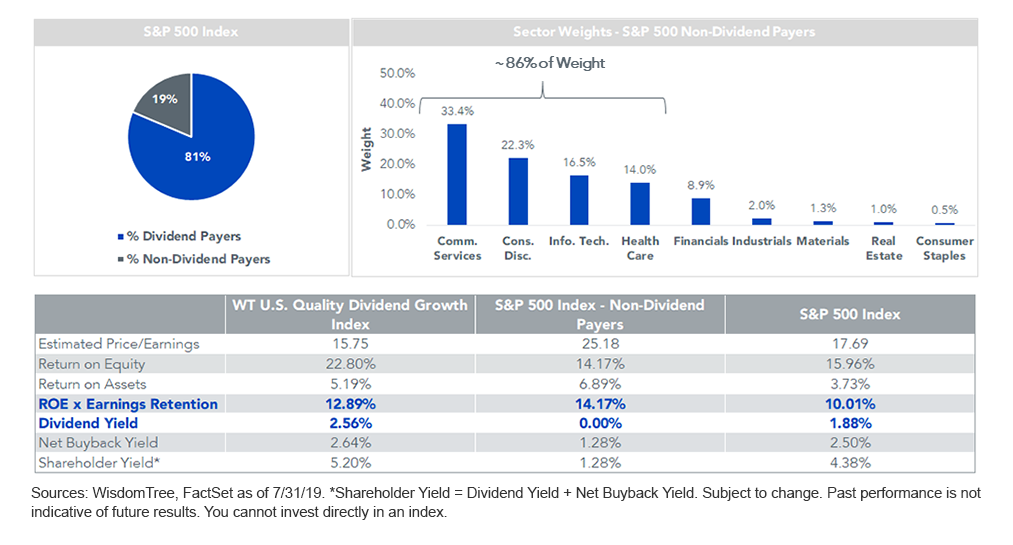
About 19% of the weight of the S&P 500 Index is in non-dividend payers—these companies would be ineligible for an indexing approach that screens on dividends.
The chart below shows the fundamentals and sector exposures of that 19% that is excluded and compares the fundamentals to the WisdomTree U.S. Quality Dividend Growth Index (WTDGI) and the S&P 500 Index.
To no surprise, the non-dividend payers tilt toward growth, as seen by the sector exposures, the substantial price/earnings (P/E) premium and high profitability. Higher valuations and a shareholder yield of around 1% make future returns much riskier, in our view, than a broad basket (~300 stocks for WTDGI) of high-quality dividend-paying securities.
WTDGI boasted a few distinct advantages over the S&P 500 from a fundamentals perspective:
- A discounted P/E multiple
- Higher ROE and return on assets (ROA)
- Dividend yield advantage of 69 basis points (bps) and a shareholder yield of over 5%—a significant return of capital to shareholders in a low-rate environment
- Higher implied dividend growth (ROE x earnings retention)—included in the denominator of the GGM
S&P 500 and WisdomTree U.S. Quality Dividend Growth Index
Real-Time Impact: The Quality Overlay to Dividends
You may be surprised to find that a dividend-based approach to U.S. equities could have kept pace with the S&P 500 over the past six-plus years—as we mentioned earlier, that 19% of stocks that do not pay dividends have performed very well! But WTDGI has mostly kept pace over its live track record. And through July 31, 2019, it has outperformed by 24 bps annualized.
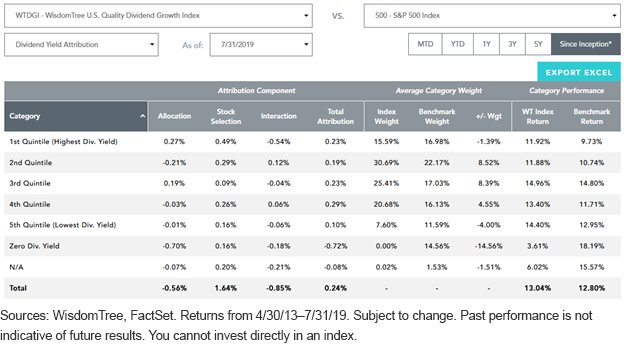
If we look at the below dividend yield attribution for WTDGI versus the S&P 500, there is a clear relationship between higher dividend yields and lower category performance.
Since the inception of WTDGI, the highest-yielding quintile of the S&P 500 returned 9.73%. The lowest yielders returned 12.95%, and the non-dividend group returned 18.19%.
But if we look at the top two yielding quintiles within WTDGI, these higher-yielding securities with a quality overlay performed much better than those high-yield quintiles in the benchmark with no such quality filter. WTDGI banked 78 bps of positive stock selection combined from the first two quintiles.
Dividend Yield Attribution
Conclusion
In hindsight, it’s easy to see that being underweight non-dividend payers was a drag on performance over this period. But the substantial impact that dividends have had on long-run historical performance makes us reluctant to think this trend of outperformance will continue indefinitely.
The current balanced make-up between strong profitability metrics and discounted relative valuations for WTDGI, largely achieved by avoiding the more expensive non-dividend payers, gives us confidence in the merits of this approach for a core U.S. equity allocation going forward.
1Stocks for the Long Run, 2014, p. 149.
Share & Comment
Popular Posts
Categories
Related Links