UST 10-Year… Where Do We Go from Here?


After a Federal Reserve (Fed) meeting like the one last week, it’s always prudent to take a step back and let the dust settle, don’t you think? Certainly, a great deal of “post-game” analysis has already occurred, and we have even seen economists’ Fed Funds forecasts for this year get visibly adjusted as a result. So, let’s take a look at the U.S. Treasury (UST) 10-Year yield and ask ourselves the question: Where do we go from here?
In order to answer, you probably need to start with the near-term Fed outlook. As of this writing, Fed Funds Futures have a 100% implied probability that the FOMC will cut the target range at their next meeting on July 31. While it appears the majority expectation is for a 25 basis points (bps) reduction, there is a chorus of 50 bps cuts out there as well.
UST 10-Year Yield Technical Analysis

Against this backdrop, it is more vital than ever for investors to focus on incoming data, much like Powell & Co. emphasized they were going to do. If you’re keeping track, that means we basically have just one more month’s worth of economic indicators to digest by the time the end of July rolls around, with the jobs report, consumer spending data and PMI releases all most likely taking center stage.
There is no doubt that trade uncertainty, and the knock-on effects it creates, is also weighing on the Fed’s decision-making process. With that in mind, the upcoming G-20 meeting this weekend in Osaka, Japan, could also be a potential key event. While a “final conclusion” in the U.S./China trade dispute does not appear likely, if President Trump and Premier Xi Jinping can produce a “thaw” and give the impression that negotiations are back on track, the UST market will take notice (yields could rise). Of course, the opposite is true as well—in other words, a disappointing outcome (yields could fall).
Conclusion
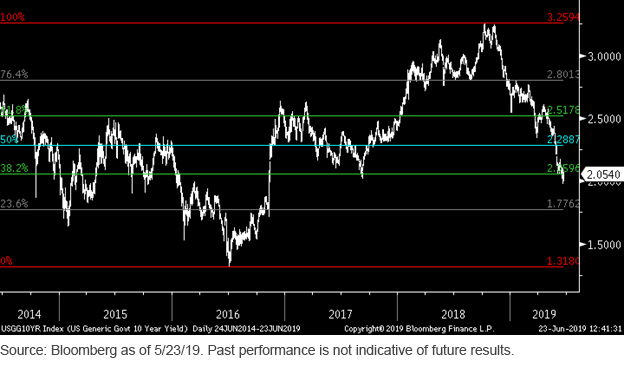
Back to the UST 10-Year yield. The enclosed graph shows the five-year Fibonacci retracement levels. As you can see, the 10-Year broke through the 2.0596% level last week, which puts in play 1.7762% as the next stop on the train. While a move down to this territory doesn’t represent my base case, I’ve learned over the years to never “fight the tape.” That being said, if the upcoming econ data doesn’t “fall out of bed,” perhaps we could see the UST 10-Year yield bottoming out around the 2% threshold it has been straddling in recent days.
Unless otherwise stated, data source is Bloomberg, as of June 23, 2019.


