Growth Stocks: You’d Better Be Seabiscuit


This is Part 2 of a two-part blog series on the prospects for growth and value stocks. Please see Part 1, “Growth Stocks: Where’s the Beef?”
When your starting point is a 1.5% dividend yield—as is the case with the S&P 500 Growth Index—the group of stocks better have long-term dividend growth that races like Seabiscuit, the super horse. No tripping out of the gate or getting bumped in the stretch. Everything must go perfectly.
Riding on our concepts from “Dividend Growth’s Drivers: Picking Apart Quality,” we present figure 1, which shows the relationship between the retention ratio (the percentage of earnings retained) and return on equity (ROE), and the company’s net income as a percentage of shareholders’ equity.
This relationship is the driver of dividend growth. And as the years go on, concepts similar to the critical equation in figure 1 have become core tenets of WisdomTree.
Figure 1: The Critical Equation

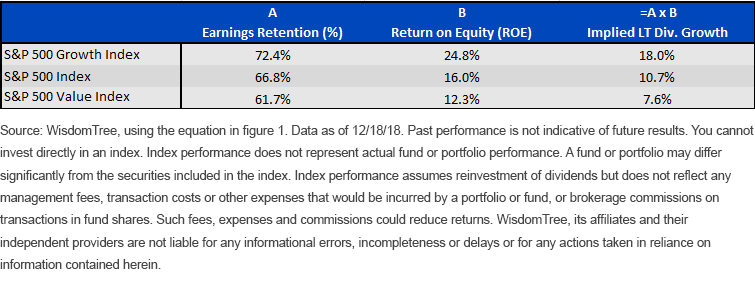
Figure 2 uses the critical equation to calculate long-term dividend growth for three indexes at prevailing profitability levels.
The S&P 500 Growth Index’s current ROE of 24.8% implies long-term dividend growth of 18%. That’s huge. And it could happen, yes. Anything can happen. But here’s a better idea: expect downward revisions to what looks like an unsustainable ROE.
Figure 2: Implied Dividend Growth Estimate

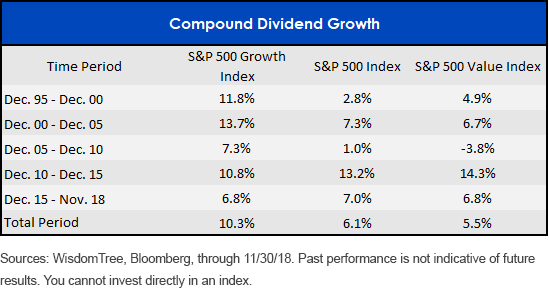
The S&P 500 Value Index’s current 12.3% ROE is reasonable. The math of its 7.6% “long-term” earnings growth could play out because that outcome falls within the historic record. But figure 3 shows that for the S&P 500 Growth Index, there isn’t a five-year period that had earnings running forward at an 18% clip—not even in the 1990s, when the economy was buzzing like someone four coffees deep.
Figure 3: Dividend Growth Rate, 5-Year Chunks, 1995–Present

Slow and Boring? Better than Growing Out of 1.5%
The so-called “slow-growth” S&P 500 Value Index has a starting point today of a dividend yield that is about double that of the S&P 500 Growth Index. This kind of gap makes it nearly impossible for the latter index to ever grow out of its valuation.
For growth stock skeptics, the approaches that jump out in our value camp are the WisdomTree U.S. Dividend ex-Financials Index, tracked by the WisdomTree U.S. Dividend ex-Financials Fund (DTN), and the WisdomTree U.S. High Dividend Index, tracked by the WisdomTree U.S. High Dividend Fund (DHS). The latter’s fundamentals are now in “deep value” territory.
The former Index retains about 37% of its earnings and has an ROE of 13.2%. The latter retains 39% and has an ROE of 13.7%. Using the “critical equation,” both have long-term implied dividend growth of 5%. Paltry, yes. But when the starting point is 4.7% and 4.4% dividend yields, respectively, the fashionable companies that populate indexes like the S&P 500 Growth Index can run up their dividends at a 15% or 20% clip every year for a long time before the math clicks in their favor.
For investors who do not want to commit to value because they have been burned for so long, something like the WisdomTree U.S. Quality Dividend Growth Fund (DGRW)—which tracks the WisdomTree U.S. Quality Dividend Growth Index—is a more “growthy” index, but its dividend weighting methodology checks valuations at the door. That gives it a starting dividend yield of 2.9%, about double that of the S&P 500 Growth Index. It also screens for ROE and return on assets.
This is the nuts and bolts of why WisdomTree exists and why exchange-traded funds are taking market share from mutual funds. Over the next 5 or 10 years, we’ll take DGRW, DTN or DHS over the S&P 500 Growth Index. This is where the rubber meets the road—when the cap-weighted U.S. large- cap growth indexes start to be priced like they’re Seabiscuit on a good night’s rest, but in reality they are an underlay to be faded.
Unless otherwise stated, all data is from Bloomberg as of December 18, 2018.
Important Risks Related to this Article
There are risks associated with investing, including possible loss of principal. Funds focusing their investments on certain sectors increase their vulnerability to any single economic or regulatory development. This may result in greater share price volatility. Please read each Fund’’ prospectus for specific details regarding the Fund’s risk profile.


