
Fed Watch: A Delicate Balancing Act


When investors talk about the Federal Reserve (Fed), the natural focus tends to gravitate toward the potential for rate action, and in our present situation, that would mean future rate hikes. However, in response to the financial crisis and recession, the Fed deployed a new and different part of its arsenal—its balance sheet, underscoring the depth and scope of the policy responses that were deemed necessary at that time. While the policy makers have been raising the Federal Funds target range since 2015, it was only last year—right around this time of year, in fact—that the Fed started to address the balance sheet part of the equation. In other words, for the last 12 months, the FOMC has not only been methodically increasing interest rates, it also has been gradually reducing the size of the balance sheet at the same time. Prior to this policy normalization process, the money and bond markets gravitated toward the notion that these simultaneous actions definitely would be a delicate balancing act. Indeed, not only had such extraordinary measures of policy accommodation never been attempted in modern times, but it certainly then follows that the reversal of these policies would be unprecedented as well.
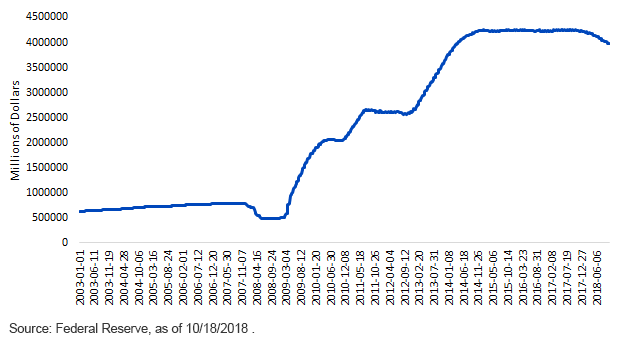
Fed Holdings of Treasuries, Agency Debt & MBS
So, what are we actually talking about when we say “the Fed’s balance sheet”? It is a broad term the market has embraced that encompasses the policy makers’ holdings of U.S. Treasuries (UST), federal agency debt and mortgage-backed securities (MBS). In reality, the Fed’s balance sheet includes other assets such as float and credit loans to banks, to name a couple, but for this blog post, we will use the market’s definition. The official title for the Fed’s holdings of the aforementioned assets is known as “securities held outright” by the System Open Market Account (SOMA).
Have you had enough of “Fed Balance Sheet 101” yet? OK, let’s turn our attention to what the Fed has accomplished in shrinking its SOMA holdings since the normalization plan began a year ago—but first, let’s get some perspective. Prior to the financial crisis and recession, the Fed’s securities holdings stood at roughly $790 billion and ballooned to more than $4.2 trillion as of the end of September last year. One year into the normalization process and the SOMA holdings have declined by almost $264 billion, down to $3.98 trillion as of this writing. Breaking it down by major asset class, UST holdings have fallen by $171 billion, or 65% of the total drawdown, while the MBS portion is off by $88 billion, representing 33%. The residual comes from the agency debt holdings.
Conclusion
Where does the balance sheet normalization go from here? At the September FOMC meeting, the policy makers announced the final leg of their prearranged plan. Effective this month, the Fed will implement a reinvestment drawdown of $30 billion in Treasuries and $20 billion in MBS per month for a grand total of $150 billion per quarter. As of now, this is the schedule the Fed laid out in June 2017, and there have been no hints of any amendments to this process—at least, not yet. One has to admit that given the unprecedented scope of the Fed’s tightening measures, there really hasn’t been any ripple of consequence for the U.S. money and bond markets, the policy makers’ goal all along. Interestingly, the question may now turn to when and how the Fed will decide to alter their approach in the future.
Unless otherwise stated, all data source is Federal Reserve as of October 18, 2018.
Share & Comment
Popular Posts
Categories
Related Links