How to Avoid Leverage Risks in Small Caps


A relative bright spot amid a challenging start to 2018 for U.S. equities has been the performance of small caps: The Russell 2000 Index’s 4.65% return is an advantage of more than 180 basis points (bps) over the 2.82% return of the S&P 500 Index.1 As analyzed in my colleague’s recent blog post, small caps often outperform during rising rate environments. A unique feature of this rising rate environment is the unprecedented era of monetary easing from which we are emerging that has coincided with increased levels of debt financing. Different small-cap indexes provide significantly different exposures to potential pockets of excessive leverage risks, and now is as necessary a time as any for a review.
Rate Rises Picking Up Momentum
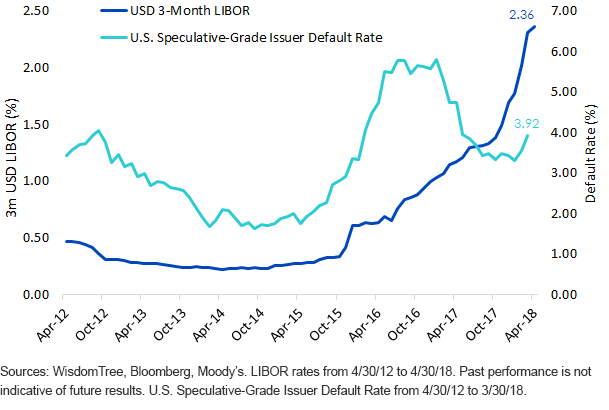
The Federal Reserve’s gradual and well-telegraphed rate hikes over the past several years have been widely lauded for not pulling the rug out from under the financial system. However, for a variety of reasons, both technical and structural, the main benchmark floating rate (USD 3-month LIBOR) has increased by more than 100 bps over the past year.2 While this rate matters for the interest expense of large caps, it matters even more for small caps. Of the constituents of the Russell 2000, 48% of their debt is linked to floating rates, as opposed to just 9% for the S&P 500.3 As this rate has risen, the default rates for speculative-grade issuers have also begun to tick up, albeit from low levels compared to the past two years. The signal is clear: Rates are rising, and speculative, unprofitable firms may have a difficult time refinancing at higher rates.
Rising Rates Coinciding with Speculative-Grade Defaults

Earnings Weighted vs. Market Cap Weighted
When explaining why WisdomTree decided to create an earnings-weighted family, we often discuss the merits of a disciplined annual rebalance that raises earnings yields and lowers price-to-earnings (P/E) ratios. The WisdomTree U.S. SmallCap Earnings Index selects only profitable companies for inclusion at each December rebalance, and then weights companies by their contribution to total core earnings over the prior annual cycle. This value-sensitive rebalance has gained greater investor intrigue at today’s elevated valuations for market cap-weighted indexes. The current trailing P/E ratio of the WisdomTree U.S. SmallCap Earnings Index is a somewhat modest 14x, which compares to the near 40x for the Russell 2000, an index with 22% weight in unprofitable companies.4

In addition to the benefits of a value exposure, an equally important byproduct to this fundamentally focused rebalance is greater exposure to quality companies. By selecting only profitable companies and then weighting by those companies, WisdomTree avoids those parts of the market that may have the greatest difficulty meeting debt obligations. When looking at leverage ratios in isolation, leverage of the WisdomTree Index and the Russell 2000 are actually at similar levels of 4.5 and 4.3, respectively, based on assets/equity.
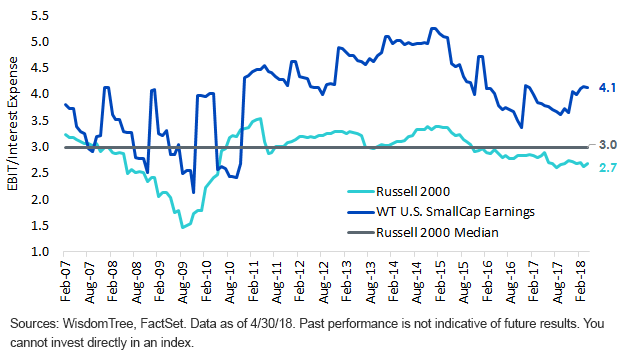
On the other hand, analyzing the historical changes in interest coverage ratios, measured as EBIT/interest expense, provides a meaningfully different picture. The interest coverage ratio indicates sustainable costs of debt compared to earnings, and the trend for the Russell 2000 since 2015 has been a clear increase in interest expense as a share of earnings. At the current level of 2.7 for the Russell 2000, it is below its median of 3.0 since 2007 and, prior to 2017, at levels last touched in 2010. While the trend for the WisdomTree U.S. SmallCap Earnings Index is in the same direction, because of the profitability focused tilt to the Index, there is a more than 50% improvement in the ratio of earnings to interest costs.
Interest Coverage Ratios
2/28/2007–4/30/2018

Conclusion: An Annual Rebalance to Quality at a Discount
Fed tightening alone does not seem to pose dire consequences for U.S. equities broadly. Rates are still at low levels historically, and as the path of hikes continues to be data dependent on economic growth, we favor small caps to outperform. However, as we are in the later stages of this bull market, a focus on holding onto quality companies with sustainable levels of debt seems to make increasing sense over a market cap-weighted approach that is trading at extreme P/E premiums. The market cap-weighted Index has been steadily trending toward lower interest coverage over the past three years. During this timeframe, WisdomTree’s Index has undergone three December rebalances that have increased that ratio by assigning greater weight to higher earners.
1Source: Bloomberg, 12/29/17–5/14/18.
2Source: Bloomberg, 5/2/17–5/2/18.
3Source: Jessica Binder Graham, Deep Mehta, Ronny Scardino and Tarun Lalwani, “Small Cap Opportunities: More Near-Term Pluses than Minuses,” Goldman Sachs, 3/29/18.
4Sources: WisdomTree, FactSet. Data as of 4/30/18.


