
Why Small-Cap Put Writing Indexes Make Sense


Volatility is often a big concern for investors when allocating to risky assets such as small-cap equities. I recently demonstrated how investors can mitigate risk in their small-cap allocations by utilizing strategies such as the WisdomTree CBOE Russell 2000 PutWrite Strategy Fund (RPUT).
The strategy is designed to sell cash-secured monthly put options on the Russell 2000 Index and collect premiums that act as a cushion during market drawdowns. The cost of protection—option premiums—are a function of volatility, so they tend to decline during periods of low volatility. With increasing volatility, now may be the right time to allocate to a strategy that collects option premiums.
Here I extend my previous analysis to the small-cap universe, thus analyzing both faces of volatility (implied volatility and realized volatility) to get a more complete picture.
Volatility: Implied vs. Realized
2017 was the ninth consecutive year for the S&P 500 to have delivered positive returns; the last year the S&P 500 had negative returns was in 2008.1 Market runs this long are not common—since the 1950s, there have been only two bull runs (1983–1989 and 1991–1999) of similar length as the current run. Bulls argue we are in a phase of synchronized global growth, with the U.S. leading global economic recovery and Europe, Japan and emerging markets closely following behind. As a result, the Cboe Volatility Index and Russell 2000 Volatility Index (VIX and RVX, respectively)—which are popularly considered to be gauges of investor fear and track the outlook for next 30-day volatility in large and small caps, respectively—are at their all-time lows.
Therefore, put premiums collected in any strategy like RPUT, which are priced based on the market’s forward outlook for volatility or implied volatility, should go down. Implied volatility is just one face of volatility, and to get the complete picture, we also need to see the other side, which is realized volatility or actual trailing volatility.
The gray line in the chart below shows implied volatility in small caps, or the RVX. Though the RVX itself may be low, what is more interesting is that 30-day realized (or trailing) volatility is even lower. Even after recent noise in markets, their spread—i.e., implied minus realized—continues to trend significantly high compared to historical levels!
Rising Spreads of Implied Volatility Over Realized Volatility Making a Case for Selling Implied Volatility
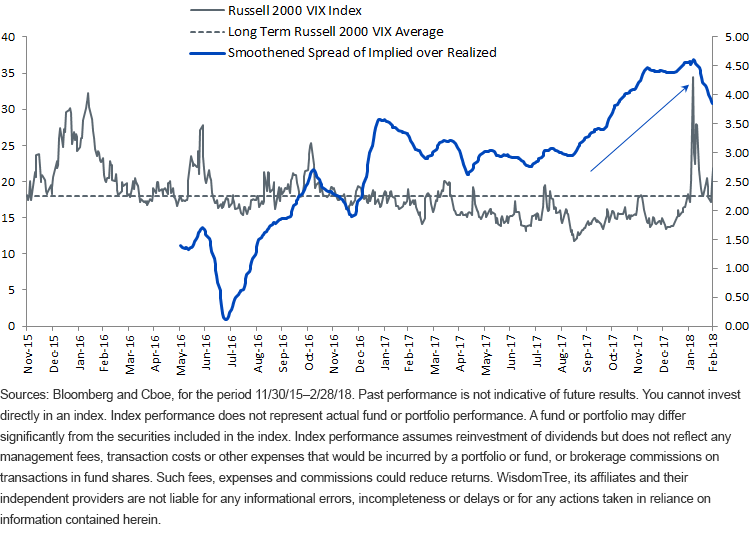
Now, just as buying downside protection is a bet that realized volatility would increase more than current implied volatility, selling an option is a reverse of this. In other words, as long as implied volatility stays above realized volatility, people buying protection are overpaying, while people selling protection are collecting rich premiums. What ultimately matters for a strategy like RPUT, which collects put premiums every month, is implied volatility being above realized volatility.
Thus, when we look at both faces of volatility, the picture becomes more complete for strategies like RPUT. Selling put options and collecting premiums in the current environment has been akin to sticking to the fundamentals of investing: selling expensive, richly priced assets!
Thinner Tails of the Strategy Indicate Lower Likelihood of Extreme Returns
In addition to the premiums generated by RPUT as a driver of return, we believe risk management is another reason to consider RPUT. We show a bell curve distribution of returns that buckets historical returns of two indexes on the x-axis and counts the number of observations corresponding to each bucket or slot on the y-axis.
Since the underlying index of RPUT—Cboe Russell 2000 PutWrite Index (PUTR)—began in November 2015, we compare PUTR to the Russell 2000 Index to get the complete two-year historical data. If a strategy is less volatile, most of its returns should be concentrated in buckets closer to zero, while a more volatile strategy would see a higher number of observations in return buckets that are more extreme or far away from zero. Risk managers call this chart the distribution of returns.
Less Fat Tails of PUTR Index - Imply Better Historical Protection for Investors in Small Caps
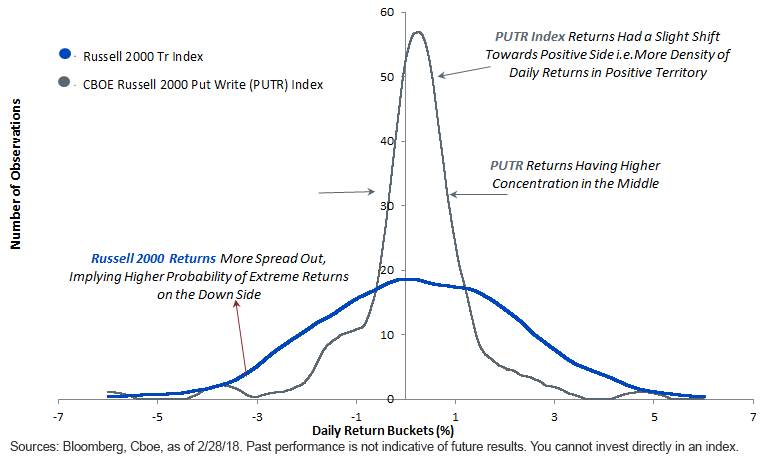
There are three immediate takeaways from this chart:
1. RPUT’s distributions were concentrated mostly in the middle—a return profile that shows closer to the mean.
2. The Russell 2000 Index was much more spread out—a return profile that swings much more away from the mean and has fatter tails (or a higher number of extreme observations).
3. Slight right skew or tile of RPUT distribution—a return profile with higher density of daily returns in positive territory.
Capturing Small-Cap Beta with Less Volatility
In essence, what I am trying to convey is that looking at either implied or realized volatility is just half the story. To get a complete picture, we need to consider both. And an option selling strategy like RPUT is the spread between the volatilities.
If markets continue to go up, investors of PUTR would continue to collect premiums and have positive returns. If markets go down, these richly priced premiums would offer protection against those drawdowns.
1Source: Bloomberg, as of 2/28/18.
Important Risks Related to this Article
There are risks associated with investing, including possible loss of principal. The Fund will invest in derivatives, including Russell 2000 Index put options (“RUT Puts”). Derivative investments can be volatile, and these investments may be less liquid than securities, and more sensitive to the effects of varied economic conditions. The value of the RUT Puts in which the Fund invests is partly based on the volatility used by market participants to price such options (i.e., implied volatility). The options values are partly based on the volatility used by dealers to price such options, so increases in the implied volatility of such options will cause the value of such options to increase, which will result in a corresponding increase in the liabilities of the Fund and a decrease in the Fund’s NAV. Options may be subject to volatile swings in price influenced by changes in the value of the underlying instrument. The potential return to the Fund is limited to the amount of option premiums it receives; however, the Fund can potentially lose up to the entire strike price of each option it sells. Due to the investment strategy of the Fund, it may make higher capital gain distributions than other ETFs. Please read the Fund’s prospectus for specific details regarding the Fund’s risk profile.Share & Comment
Popular Posts
Categories
Related Links