Evaluating Market Dynamics and Exposures via Attribution


WisdomTree has been enhancing its technology infrastructure to help clients understand performance drivers of our Indexes, the markets generally and how to optimize portfolios. One new attribution engine we developed has been particularly helpful in evaluating market dynamics.
Below I highlight how various factors are impacting U.S. large-cap stocks in 2017 through October 31.
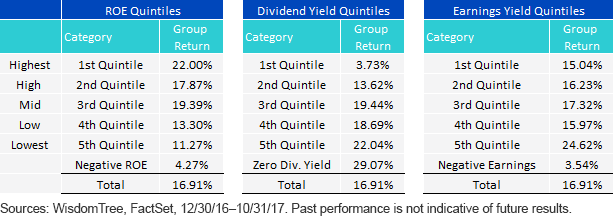
- Profitability as a factor has been rewarded in 2017. Breaking out the S&P 500 into quintiles of factors, profitability or return-on-equity (ROE) quintiles had large differences in returns, with the top three ROE quintiles showing significantly better returns than the bottom two ROE quintiles and negative earners. ROE as a factor mattered.
- On a dividend yield basis, there was significant underperformance of the top dividend yield quintiles compared to the lowest-dividend quintile or zero-dividend-yield stocks. Dividend yield has been an unhelpful factor in 2017.
- On an earnings yield basis, again cheaper stocks lagged the more expensive stocks, with the first quintile stocks with highest earnings yields (lowest P/E ratios) having the worst returns and the fifth quintile for most expensive, lowest-earnings-yield stocks having the best returns. P/E ratio did not matter.
Market Drivers of the S&P 500, by Fundamental Metrics

Let’s drill further into two WisdomTree Indexes on opposite sides of the performance bar in 2017 to understand market behavior more: the broad WisdomTree U.S. Dividend Index, which lagged with over-weights to high dividend stocks, and the WisdomTree U.S. Quality Dividend Growth Index, which outperformed alongside the high-ROE quintiles.
Standard Sector Analysis
Let’s begin the performance decomposition with sector analysis of the WisdomTree U.S. Dividend Index compared to a broad market capitalization-weighted index, the MSCI U.S.A Index.

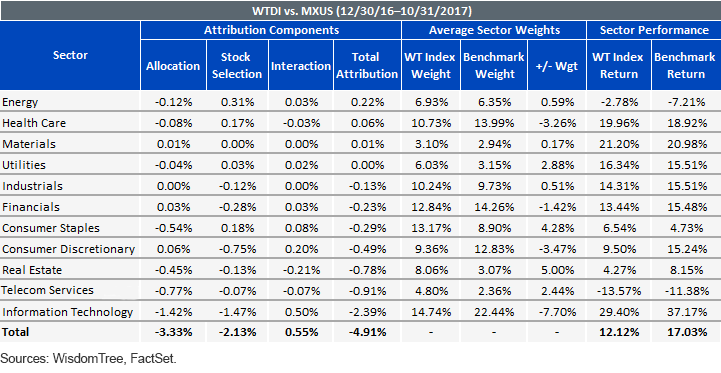
Year-to-date, the WisdomTree U.S. Dividend Index had a tough performance period, lagging the benchmark by just under 500 basis points.
Explaining the attribution:
The sectors in this attribution table are sorted by the “total attribution,” which can come from one of three sources: The first is the allocation differences to that sector (whether it was over-weighted or under-weighted) and whether that sector outperformed the market. Then there is also stock selection within a sector—and whether the investment methodology added value compared to the benchmark within the sector. And finally, there is an interaction component between these two in terms of weighting and stock selection/methodology.
In 2017, there has been a large dispersion in returns, with the technology sector being the lead sector of the market, up 37.2% through October 31. This sector is the biggest weight in market capitalization-weighted benchmarks and the biggest differential in the WisdomTree U.S. Dividend Index compared to the market. It is no surprise that this sector thus created a drag, and approximately 50% of the performance difference year-to-date can be explained by this sector. The next two greatest drags came from high-dividend sectors—telecommunication services and real estate, both of which received greater weight in the WisdomTree U.S. Dividend Index compared to the market.
Quality Outperforming
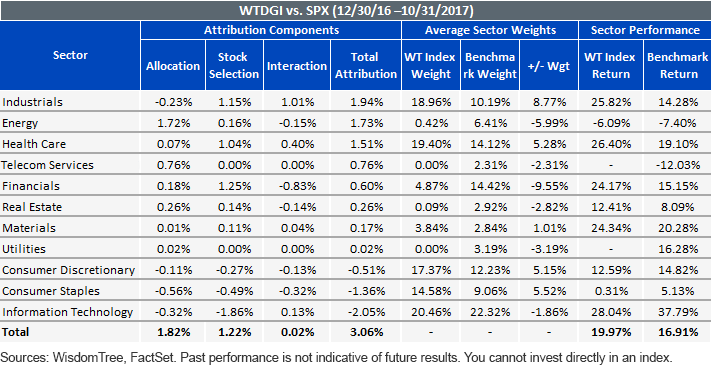
Not all dividend indexes are underperforming in 2017, however. The WisdomTree U.S. Quality Dividend Growth Index, which selects its constituents based on screens for earnings growth estimates and quality variables, is outperforming its broad, large-cap benchmark, the S&P 500 Index.
Interestingly, while this Index has closer representation to the broad market in the technology sector, in this dividend Index, technology was also a drag, as dividend-paying technology stocks and stock selection were a net drag on performance.
This was overcome by the quality Index focus on industrials, where there was a large over-weight position and also positive stock selection benefits, as well as a large under-weight to energy that benefited the Index.

Going beyond sector attribution, we can also look at this attribution according to fundamental sorts. This Quality Dividend Growth Index has a sorting process that rewards companies with higher ROE than the market. Comparing ROE quintiles of the WisdomTree U.S. Quality Dividend Growth Index to the S&P 500, as shown earlier, one can see that in the first quintile, for highest-ROE companies, the WisdomTree U.S. Quality Dividend Growth Index has 42.9% allocated there, while the market has only 22.8% there.
This over-weight was one of the top drivers of performance. The other segment that really helped was under-weighting the lowest-profitability stocks, the fifth quintile of ROE, which was only 2.1% of the WisdomTree U.S. Quality Dividend Growth Index but 15.3% of the S&P 500. Both the under-weight to this sector but also stock selection within that quintile helped.
In general, what this table shows is the WisdomTree U.S. Quality Dividend Growth Index has more than 90% allocated to the top three quintiles by ROE, whereas the S&P 500 only has about 60% allocated there. These profitability tilts were rewarded in 2017, and it also helps to understand the general approach of the WisdomTree Index to focus on the highest-profitability stocks while avoiding the worst-ranking ROE stocks.
ROE Quintiles: WTDGI

While understanding the drivers of performance in 2017 cannot lead you to say these ROE quintiles will continue to perform as they have, it does help you understand market dynamics more fully. Dividend yield as a factor has not been rewarded in 2017—perhaps so much that it will cause some to start exploring it as a candidate for mean reversion opportunities given the relative underperformance for the highest-quintile stocks.

Jeremy Schwartz has served as our Global Chief Investment Officer since November 2021 and leads WisdomTree’s investment strategy team in the construction of WisdomTree’s equity Indexes, quantitative active strategies and multi-asset Model Portfolios. Jeremy joined WisdomTree in May 2005 as a Senior Analyst, adding Deputy Director of Research to his responsibilities in February 2007. He served as Director of Research from October 2008 to October 2018 and as Global Head of Research from November 2018 to November 2021. Before joining WisdomTree, he was a head research assistant for Professor Jeremy Siegel and, in 2022, became his co-author on the sixth edition of the book Stocks for the Long Run. Jeremy is also co-author of the Financial Analysts Journal paper “What Happened to the Original Stocks in the S&P 500?” He received his B.S. in economics from The Wharton School of the University of Pennsylvania and hosts the Wharton Business Radio program Behind the Markets on SiriusXM 132. Jeremy is a member of the CFA Society of Philadelphia.

