
U.S. Economy: Grading on a Curve


With three-quarters of calendar year 2017 now in the books, investors may wonder where the U.S. economy goes from here. Last week, the Bureau of Economic Analysis reported that third-quarter real gross domestic product (GDP) rose at an annual rate of +3.0%, following on the heels of a +3.1% reading in the second quarter. This was the best back-to-back quarterly performances in exactly three years. Is there any type of gauge that could help investors, or perhaps at least provide some guidance on what could be looming ahead? One such gauge is the U.S. Treasury (UST) yield curve.
When observing trends in the UST market, the focus tends to be on developments for the 10-Year maturity. However, not all Treasury maturities are the same in terms of how their respective yields respond to different factors. Against this backdrop, to get a more detailed sense of overall sentiment on the rate front, we recommend analyzing the yield curve.
U.S. Treasury 2-Year vs. 10-Year
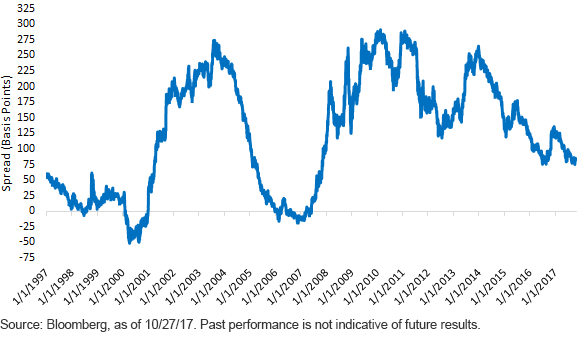
So where does the UST yield curve stand as we enter the final two months of 2017? The predominant year-to-date trend has been for the 2-Year/10-Year spread to flatten. To provide some perspective, since late December, this spread has narrowed by more than 50 basis points (bps) to +82 bps, as of this writing. How has this flattening occurred? This narrowing trend has been a clear illustration that yield levelsamong UST maturities do not necessarily move in the same direction. In this case, the UST 2-Year yield rose 40 bps, while the 10-Year rate fell almost 15 bps.
That leads to the question, why did short-term rates rise while longer-dated yields moved lower? The first part of the equation lies with the Federal Reserve (Fed). Thus far this year, the U.S. central bank has raised the Fed Funds target twice, and despite the pause at the September Federal Open Market Committee meeting, additional increases are still expected for later this year and into 2018. The front end of the yield curve, or shorter-dated maturities such as a UST 2-Year note, tend to be the area that is most directly affected by changes in the Fed Funds Rate.
Longer-dated maturities, such as the UST 10-Year note, are further removed from these developments and also tend to be influenced by other factors such as future economic growth forecasts, inflation expectations and flight-to-quality issues. These three “legs of the stool” help to explain why the UST 10-Year yield has fallen this year despite two rate hikes and the announcement that the Fed is embarking on the balance sheet normalization process as well. Specifically, lack of progress on tax reform/cuts has dampened the growth outlook at the same time inflation readings have visibly declined from their earlier 2017 peaks. In addition, sporadic headlines surrounding North Korea have given rise to safe-haven investing.
Conclusion
As of this writing, the current spread is only 16 bps below the long-run average, which is +98 bps for the record. Over time, an “inverted” yield curve (the 10-Year yield was below the 2-Year yield) has been a precursor for a subsequent recession. Interestingly, the UST yield curve has been in negative territory only on a handful of occasions over the last 40 years. Other than for a brief period last year, the 2-Year/10-Year spread hasn’t been this narrow since 2007. However, it is important to point out the current differential is still well above negative territory, and considering the predictability of this gauge in the past, the UST yield curve does not appear to be signaling that a recession is looming around the corner.
Unless otherwise noted, data source is Bloomberg as of October 27, 2017.
Share & Comment
Popular Posts
Categories
Related Links