Is the Current U.S. Equity Market Rally Sustainable?


U.S. equities continue to be a beacon of growth on a year-to-date (YTD) basis. With a YTD performance for the S&P 500 of +11.6%,1 many debate whether drivers of this market rally are macroeconomic numbers, the turnaround in corporate earnings or something else. Is there anything we can say about whether this trend will continue?
I believe our answer may lie in a unique technical pattern that markets have been showing in a post-quantitative easing (QE) world that I will describe below.
Interplay of Market and Diversification
Finance 101 tells us that assets move in unison during stress periods, challenging investors looking for diversification. Correlations can also go up in a rising market, but experience shows us that such rallies are less sustainable in the long run.
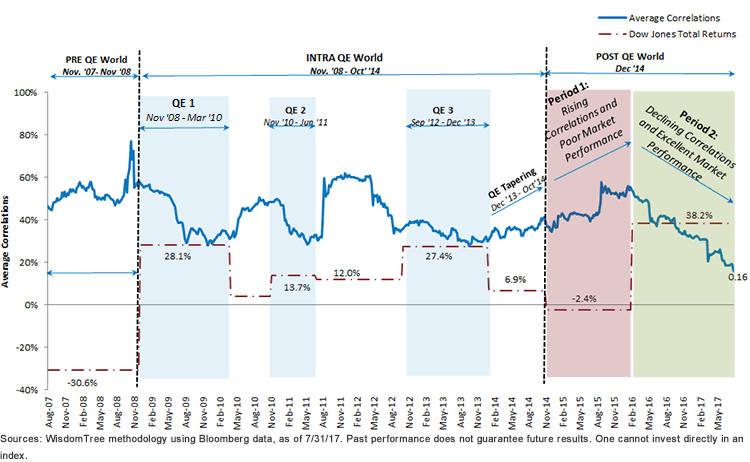
To visualize this interplay of U.S. equities and prevailing average correlations, I plotted the chart below. The chart plots the average of all possible pair-wise trailing six-month correlations of equities in a broad index (i.e., Dow Jones in our analysis). This chart is indicates average correlations in the U.S. equity markets at every point in time. The chart is then overlaid with three distinct periods over the last decade:
- Period 1—Pre-QE: November 2007 through November 2008
- Period 2—Intra-QE: November 2008 through October 2014
- Period 3—Post-QE: December 2014 through July 2017
Average Correlations in a Post-QE World at an All-Time Low
7/30/07–7/30/17

Pre- and Intra-QE World
Immediately before QE, there was a spike of average correlations. This was driven by panic in the market due to the financial crisis, a liquidity crunch and an S&P that declined 30.6% during the period November 2007 through November 2008.2
This led the Federal Reserve (Fed) to come up with its bazooka of massive liquidity injection wrapped as QE. Essentially, in November 2008 the Fed announced that it would purchase up to $600 billion of agency mortgage-backed securities and agency debt, providing the economy with liquidity of $600 billion.3 Correlations reacted sharply and fell while the market immediately cheered by jumping up.
In the following few years between November 2008 and October 2014, when the Fed officially ended its QE program, we see a clear pattern:
- Effect from previous QE starts fading.
- Average correlations start rising and markets start declining.
- Fed announces another liquidity injection program, aka QE (QE2, QE3, QE tapering).
- Correlations drop off and markets jump.
Thus, simply looking at the left portion of this chart (pre- and intra-QE periods), one may assume that it was QE that pushed correlations down and markets up every time. This is where I think the right side of the chart (the post-QE world) is critical.
Post-QE World
The Fed ended its monthly asset purchase program (or QE) in October 2014 and then began the third period of our analysis—i.e., the post-QE world. Two distinct periods are remarkable this time:
- Period 1—Rising Correlations: November 2014 through January 2016
- Period 2—Declining Correlations: January 2016 through today
Standing somewhere between November 2014 and January 2016, a market observer would not have been very confident of the post-QE effect because correlations were rising and markets were declining.
However, after January 2016 we clearly see a consistent trend in correlations, as they have declined to their all-time low in the last 10 years. At the same time, markets have been rallying. Thus we might be looking at markets that are now reaping the positive effects of the massive liquidity injection that the Fed has done over the last few years and that is now showing up with a lag. Historic low correlations can potentially indicate that this market rally may have more fire to it than people think.
The Fed is also not the only game in town doing QE. This is a global market, and central banks from Europe and Japan are still providing plenty of liquidity that might also be coming into play here.
What is also interesting about this drop in correlations: it flies in the face of all those active money managers and critics of the exchange-traded fund (ETF)/passive investing trends who claim correlations in the market are rising. Clearly, ETFs and indexes generally have experienced tremendous flows over the last decade, but overall average correlations are lower today than they were 10 years ago.
Conclusion
Market valuations have extended; however, correlations themselves have not gone up but, rather, have consistently declined. With a current base number of .16, they have enough upside to go before they reach alarming levels.4 In other words, any market correction now would probably offer investors ample time to cut their allocation to U.S. equities.
In such an environment, missing on market participation because equities have run up a lot may be a painful strategy. In my opinion, for a moderate to aggressive allocation there is more to gain by riding equity allocations—especially to fundamentally strong companies and indexes built with a sensitivity to valuations.
1Source: Bloomberg, as of 7/31/17.
2Source: Bloomberg, as of 7/31/17.
3Source: Federal Reserve, as of 7/31/17.
Important Risks Related to this Article
Diversification does not eliminate the risk of experiencing investment losses.


