
Factor Investing: Back to the Fundamentals


Value, size, quality, momentum, low correlation and low volatility—these are some of the primary factors that investors have been considering on their quest for low-cost alpha. Yet many struggle to effectively measure these factor exposures among their assets. One solution is through regression analysis, or observing the sensitivity of an asset’s returns to certain factor premiums or other independent variables. For example, WisdomTree has used regression analysis to show why we believe dividends or earnings are efficient ways to tap into factors such as low volatility, quality and value. But in a world where many smart beta strategies lack historical data, regression analysis may lose its efficacy.
The question then becomes this: Is there an effective way to measure factor exposures other than regression analysis? Our answer: Bring it back to the fundamentals.
Below we show three factors—quality, value and size—based on exactly that: fundamentals. We’ll leave technical factors like low volatility, low correlation and momentum, which focus on changes in price, to a different piece.
In regard to quality and value, for each column, the first row represents the index with the most desirable fundamental number in that category. Similarly, the last row of each column represents the index with least desirable number. For example, the WisdomTree U.S. Quality Dividend Growth Index exhibits the best measure of return on assets (ROA), while the S&P 500 Equal Weight exhibits the worst, relatively speaking.
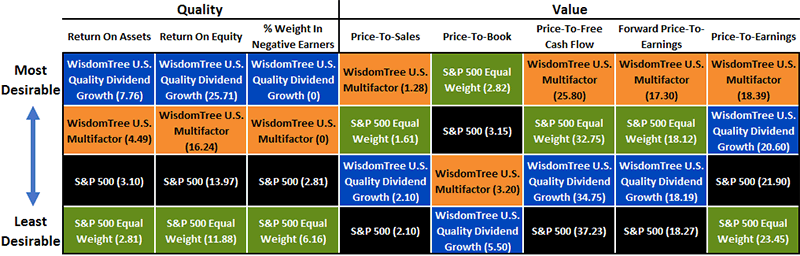
WisdomTree U.S. Quality Dividend Growth Index
- Quality: WisdomTree’s U.S. Quality Dividend Growth Index clearly captures the quality factor through higher return on assets and return on equity (ROE) than all three of the other Indexes shown, as well as 0% weight to companies with negative earnings.
- Value: In the value category, WisdomTree’s quality Index has mixed results, sometimes showing more sensitivity to the factor than the S&P market Indexes and sometimes not.
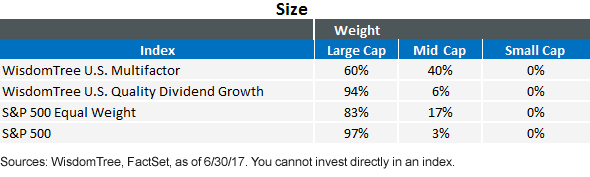
- Size: As for size, WisdomTree’s quality Index is 94% large cap, suggesting little to no size exposure. WisdomTree, however, did create a small-cap version of this quality Index.1
To us, these more desirable quality fundamentals are no surprise as this Index’s methodology focuses on ROA, ROE and growth characteristics in the large-cap category. It does not aim to beat the market’s value characteristics, though it does in some cases, such as its price-to-earnings (P/E) ratio.
WisdomTree U.S. Multifactor Index
- Quality: Though our multifactor Index doesn’t display the same strength in ROA and ROE as our dedicated quality Index, it does manage to best both market Indexes convincingly. Like our quality Index, it also holds 0% weight in companies with negative earnings.
- Value: In the value category, the WisdomTree U.S. Multifactor Index beats all other Indexes shown in four out of five categories.
- Size: While the WisdomTree U.S. Quality Dividend Growth Index and the S&P 500 Index never stood much of a chance in the size category, we do see that the WisdomTree U.S. Multifactor Index—which we’ve described as modified equal weighting in the past—has about 23% more of its constituent weight dedicated to mid-cap exposure than the S&P 500 Equal Weight Index, suggesting more size factor exposure.
Conclusion
Being that the design of the WisdomTree U.S. Multifactor Index is in fact to capture multifactor exposure, it was no surprise that its fundamentals show favorable factor exposures in quality, value and size. It’s also intuitive that a dedicated factor Index, such as our WisdomTree U.S. Quality Dividend Growth Index, would be able to achieve more attractive quality fundamentals, while sacrificing on others, such as value. Given the significant improvement the U.S. Quality Dividend Growth Index makes regarding return-on-capital measures, it is a surprise to us that the P/E ratios or other valuations are not at a significant premium to the market, as they likely deserve higher multiples.
In short, it can be hard to judge factor exposures for new strategies that lack the live data necessary for in-depth statistical analysis. However, for both new strategies and those with meaningful histories, we believe it’s important to understand their methodology, to see what fundamentals they seek to target, to consider which fundamentals are important to you and to see if they are achieving those favorable characteristics versus the market. If a “value” strategy chooses to capture value through dividends, but doesn’t have a higher dividend yield than the market, it may not be what you think it is. Likewise, if a quality index is showing desirable quality fundamentals, or if a multifactor index is showing favorable fundamentals on quality, value and size, it may provide comfort that those indexes are indeed tapping into their desired factors or long-term drivers of excess return.
1See the WisdomTree U.S. SmallCap Quality Dividend Growth Index.