Why We Apply a Quality Screen to Japan


One of the investment factors gaining popularity in the U.S. marketplace has been the quality factor. For international markets, we’ve seen growing adoption of factor investing for broad-based regions, but for country allocations, we’ve seen reluctance by investors to move beyond some of the original exchange-traded funds (ETFs) in their respective categories.
Japan is a market where WisdomTree has a unique position as being the first ETF provider to offer a currency-hedged exposure with the WisdomTree Japan Hedged Equity Fund (DXJ). DXJ employs a methodology similar to WisdomTree’s original offering of dividend-weighted stock Indexes, but it also provides a screen to global companies with a requirement that purely local Japanese stocks (those with more than 80% of revenue from Japan) are excluded from the Index.
Just over two years ago, WisdomTree launched a Japanese version of the Quality Dividend Growth Index methodology that WisdomTree debuted in 2013 in the U.S. markets. This Index methodology incorporates dividend weighting, but it has a stock-selection methodology that narrows it to stocks with high return on equity (ROE), high return on assets (ROA) (which penalizes the use of leverage) and strong earnings growth expectations.
In many ways, the quality screens WisdomTree developed four years ago foreshadowed similar screens that the JPX-Nikkei Index 400 now includes. The JPX-Nikkei Index 400 is the Abe government-promoted Index in Japan meant to encourage better focus on corporate governance and shareholder-friendly actions such as increasing dividends and buybacks to foster better ROE.
In some ways, the JPX-Nikkei Index 400 has more relaxed requirements to get included. The WisdomTree Japan Quality Dividend Growth Index employs a more stringent quality focus—for starters by including fewer stocks; only the 300 best-ranked stocks per the stock selection methodology. Moreover, WisdomTree’s ranking is done on the combined quality and growth prospects—not the total size of the firm or total size of its earnings. This ranking leads to stocks that we believe are from companies with better profitability metrics and have in aggregate stronger earnings prospects.
Return to Operating Profitability in Japan
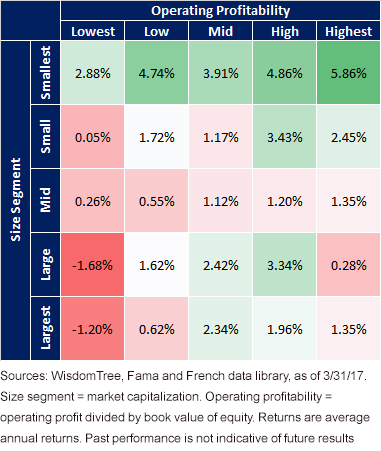
We have been presenting the case on the long-term return to operating profitability in the U.S. markets. Japan is an interesting case: At face value, knowing the market has deflated from one of the largest bubbles of all time in 1989—where value investing has been a particularly good long-term strategy—it is not obvious that a focus on just profitability metrics would have been a strong long-term strategy. Based on the Fama–French factor universe for Japan,1 however, it is clear that operating profitability worked as a factor strategy for Japan over the last three decades. Whether it is among the largest market cap stocks where the highest-profitability stocks outperformed the lowest-profitability stocks by 255 basis points (bps) per year, or the smallest cap stocks where highest-profitability stocks outperformed by just under 300 bps per year, we saw a consistent trend of profitability being rewarded in the Japan focus.
Profitability and Size, Japan Quintiles: 6/30/1990–3/31/2017

DXJ and JHDG vs. Japan Benchmarks
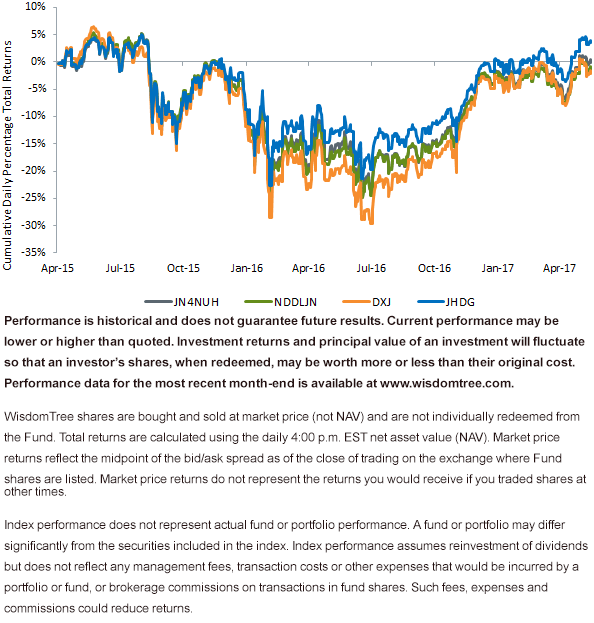
In the two years that we have been running the WisdomTree Japan Hedged Quality Dividend Growth Fund (JHDG)—our quality strategy for Japan that neutralizes the currency impact, similar to DXJ—we have also seen that quality has been working particularly well in real-time results.
Whereas DXJ has returned very close to the MSCI Japan market returns, JHDG has added about 225 bps per year ahead of the MSCI Japan Index local returns (NDDLJN) and about 165 bps per year ahead of the JPX-Nikkei Index 400 (JN4NUH).2
WisdomTree Japan Fund vs. Benchmark Indexes (April 9, 2015 — May 24, 2017)

Sector Differentials
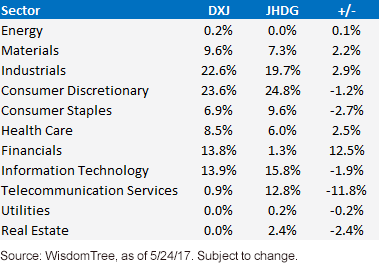
From a sector overview, the primary difference between DXJ and JHDG comes down to sector exposures. Both Funds have their largest exposure to the Consumer Discretionary sector—many of the global brands are competing at higher levels of profitability on a global basis. But beyond that sector, Telecommunications is a large exposure in JHDG and the largest over-weight compared to DXJ, along with smaller over-weights to Consumer Staples and Real Estate.

DXJ has a larger exposure to Financials than the quality fund, JHDG. Quality also is under-weight in some of the Industrials and Health Care exposures, although those are modest differences compared to Financials.
Telecom and Financials are thus the two most notable differences that quality is over-weight the former and under-weight the latter.
If you are looking at Japanese exposures and are willing to look beyond the most liquid vehicles like DXJ, we believe our Quality Dividend Growth Strategy offers an interesting long-run alternative that taps into the quality factor research discussed above.
1Fama-French factors include beta, size, value, operating profitability and investment patterns. Additional details on these factors can be found from the Kenneth R. French Data Library, http://mba.tuck.dartmouth.edu/pages/faculty/ken.french/Data_Library/f-f_5developed.html
2Source: WisdomTree, 4/9/15–5/24/17. Time frame chosen for inception of JHDG on 4/9/15.
Important Risks Related to this Article
There are risks associated with investing, including possible loss of principal. Foreign investing involves special risks, such as risk of loss from currency fluctuation or political or economic uncertainty. Funds focusing their investments on certain sectors increase their vulnerability to any single economic, regulatory or sector-specific development. This may result in greater share price volatility. The Funds focus their investments in Japan, which can be impacted by the events and developments in Japan that can adversely affect performance. Dividends are not guaranteed and a company currently paying dividends may cease paying dividends at any time. The Funds use various strategies to attempt to minimize the impact of changes in the Japanese yen against the U.S. dollar, which may not be successful.
Investments in derivative investments can be volatile, may be less liquid than securities and may be more sensitive to the effect of varied economic conditions. As these Funds can have a high concentration in some issuers, the Funds can be adversely impacted by changes affecting those issuers. The Funds invest in the securities included in, or representative of, their Index regardless of their investment merit and the Funds do not attempt to outperform their Index or take defensive positions in declining markets. Due to the investment strategy of these Funds they may make higher capital gain distributions than other ETFs. Please read each Fund’s prospectus for specific details regarding each Fund’s risk profile.
The Global Industry Classification Standard (“GICS”) was developed by and is the exclusive property and a service mark of MSCI Inc. (“MSCI”) and Standard & Poor’s (“S&P”), a division of The McGraw-Hill Companies, Inc. and is licensed for use by WisdomTree Investments, Inc. Neither MSCI, S&P nor any other party involved in making or compiling the GICS or any GICS classifications makes any express or implied warranties or representations with respect to such standard or classification (or the results to be obtained by the use thereof), and all such parties hereby expressly disclaim all warranties of originality, accuracy, completeness, merchantability and fitness for a particular purpose with respect to any such standard or classification. Without limiting any of the foregoing, in no event shall MSCI, S&P, any of their affiliates or any third party involved in making or compiling the GICS or any GICS classifications have any liability for any direct, indirect, special, punitive, consequential or any other damages (including lost profits) even if notified of the possibility of such damages.

Jeremy Schwartz has served as our Global Chief Investment Officer since November 2021 and leads WisdomTree’s investment strategy team in the construction of WisdomTree’s equity Indexes, quantitative active strategies and multi-asset Model Portfolios. Jeremy joined WisdomTree in May 2005 as a Senior Analyst, adding Deputy Director of Research to his responsibilities in February 2007. He served as Director of Research from October 2008 to October 2018 and as Global Head of Research from November 2018 to November 2021. Before joining WisdomTree, he was a head research assistant for Professor Jeremy Siegel and, in 2022, became his co-author on the sixth edition of the book Stocks for the Long Run. Jeremy is also co-author of the Financial Analysts Journal paper “What Happened to the Original Stocks in the S&P 500?” He received his B.S. in economics from The Wharton School of the University of Pennsylvania and hosts the Wharton Business Radio program Behind the Markets on SiriusXM 132. Jeremy is a member of the CFA Society of Philadelphia.

