Does It Pay for an Index to Focus on Profits?


WisdomTree has been innovating in the sphere of equity index development for more than 10 years, and along the journey we have learned many interesting things. One question that has come up through the results of our work is:
Why is the Russell 2000 Index so popular?
Russell Indexes vs. S&P Indexes
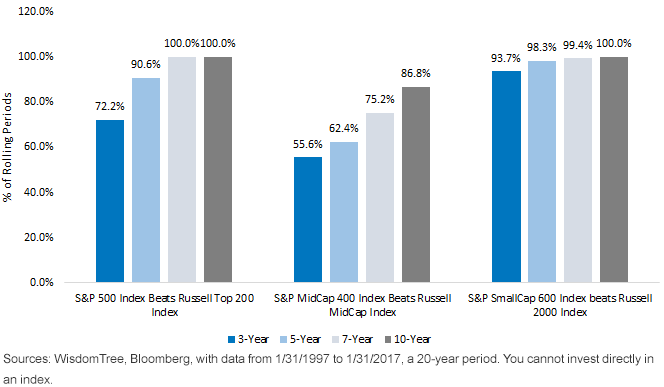
Over time, S&P indexes have tended to exhibit persistent outperformance of Russell indexes. We show, over a period looking back 20 years, the percentage of rolling 3-, 5-, 7- and 10-year periods where:
- The S&P 500 Index beat the Russell Top 200 Index (large caps)
- The S&P MidCap 400 Index beat the Russell Midcap Index (mid-caps)
- The S&P SmallCap 600 Index beat the Russell 2000 Index (small caps)
While one could never say that S&P would always outperform Russell, the consistent instances of outperformance across large-, mid-, and small-cap stocks are enough to motivate research into why there are differences in returns even among traditional “beta” approaches.
Outperformance of S&P over Russell Across Large Caps, Mid-Caps and Small Caps

Russell’s Methodology
The process begins with a very broadly inclusive approach defined by the Russell 3000E Index, which included 3,525 stocks as of December 31, 2016.1 The Russell Top 200 Index selects the largest 200 companies from this index. Ranked by market capitalization, the Russell Midcap Index is the 201st to 1,000th companies (therefore, 800 stocks). The Russell 2000 Index is the 1,001sts to 3,000th largest companies. Combined, the Russell Top 200 Index plus the Russell Midcap Index plus the Russell 2000 Index would equal the same constituents as the Russell 3000 Index.
Russell’s Bottom Line Focus: Broad inclusivity.
S&P Methodology: An important difference in S&P’s methodology for determining stocks eligible for the S&P 500 Index, the S&P MidCap 400 Index and the S&P SmallCap 600 Index is that “the sum of the most recent four consecutive quarters’ Generally Accepted Accounting Principles (GAAP) earnings (net income excluding discontinued operations) should be positive as should the most recent quarter.”2 Given that initial inclusion is in part determined by passing this measure, it tells us out of the gate that S&P tends to avoid more speculative companies.
S&P’s Bottom Line Focus: Constituents must prove themselves prior to gaining inclusion.
WisdomTree’s Logical Next Step
More than 10 years ago, WisdomTree created its Earnings Family of Indexes. Instead of focusing solely on a measure of profitability prior to initial inclusion, WisdomTree’s Earnings Family requires constituents to continually demonstrate profitability on an ongoing, annual basis.
WisdomTree’s Bottom Line Focus: Constituents must demonstrate continued profitability annually to maintain inclusion, and they must grow their earnings to garner greater weight.
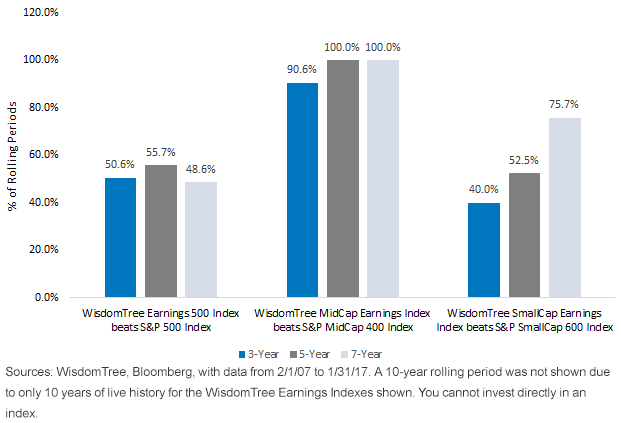
Outperformance of WisdomTree vs. Standard & Poor’s

One of the Toughest Battles in the U.S. Financial Industry
S&P has become known for its S&P’s Indices Versus Active (SPIVA) studies, which indicate the percentage of active managers beaten by its respective indexes. It really puts WisdomTree’s results above into perspective in the most difficult possible of comparisons, in that we just indicated S&P’s persistent outperformance of Russell across the capitalization size spectrum.
- Large Caps: Over the three years ended June 30, 2016, the S&P 500 Index beat 81.31% of active managers and over the five years, this index beat nearly 92% of active managers.3 Over the rolling three-, five- and seven-year periods that we looked at, it was basically a coin flip as to whether the WisdomTree Earnings 500 Index beat the S&P 500 Index over a given rolling period.
- Mid-Caps: Over the three years ended June 30, 2016, the S&P MidCap 400 Index beat 83.81% of active managers, and over five years this index beat nearly 88% of active managers4. Over the three-, five- and seven-year rolling periods shown, the WisdomTree MidCap Earnings Index nearly shut out the competition against the S&P MidCap 400 Index—a staggering feat—delivering stronger returns in nearly all of the rolling time periods measured.
- Small Caps: We have heard time and again that active management tends to thrive in small caps, viewed as a “less efficient” area of the market. Yet active managers really didn’t beat the S&P SmallCap 600 Index over either the three- or five-year periods ended June 30, 2016 (less than 6% and less than 3% of active managers won in these respective periods).5 With such a tough index to beat, achieving slightly better than a coin flip on the rolling five-year period and then over 75% of the time on the rolling seven-year period is impressive, in our view.
So, Why Is the Russell 2000 Index so Popular?
Perhaps old habits die hard? Honestly, we can’t say. We can, however, indicate that if more people are made aware of S&P versus Russell and then S&P versus WisdomTree, WisdomTree’s Earnings Family could look more and more interesting.
1Source: Russell 3000E Index fact sheet, as of 12/31/16.
2Source:“S&P U.S. Indices Methodology,” S&P Dow Jones Indices, January 2017. Source: SPIVA U.S. Scorecard published for period ended 6/30/16, the most recently available as of this writing. The S&P 500 Index is compared to the “all large cap funds” category, which included 1,044 funds at the start of the three-year period and 1,069 at the start of the five-year period. Past performance is no guarantee of future results.
3Source: SPIVA U.S. Scorecard published for period ended 6/30/16, the most recently available as of this writing. The S&P MidCap 400 Index is compared to the “all mid-cap funds” category, which included 385 funds at the start of the three-year period and 408 funds at the start of the five-year period. Past performance is not a guarantee of future results.
4Source: SPIVA U.S. Scorecard published for period ended 6/30/16, the most recently available as of this writing. The S&P SmallCap 600 Index is compared to the “all small-cap funds” category, which included 609 funds at the start of the three-year period and 622 funds at the start of the five-year period. Past performance is not a guarantee of future results.

Christopher Gannatti began at WisdomTree as a Research Analyst in December 2010, working directly with Jeremy Schwartz, CFA®, Director of Research. In January of 2014, he was promoted to Associate Director of Research where he was responsible to lead different groups of analysts and strategists within the broader Research team at WisdomTree. In February of 2018, Christopher was promoted to Head of Research, Europe, where he was based out of WisdomTree’s London office and was responsible for the full WisdomTree research effort within the European market, as well as supporting the UCITs platform globally. In November 2021, Christopher was promoted to Global Head of Research, now responsible for numerous communications on investment strategy globally, particularly in the thematic equity space. Christopher came to WisdomTree from Lord Abbett, where he worked for four and a half years as a Regional Consultant. He received his MBA in Quantitative Finance, Accounting, and Economics from NYU’s Stern School of Business in 2010, and he received his bachelor’s degree from Colgate University in Economics in 2006. Christopher is a holder of the Chartered Financial Analyst Designation.

