U.S. Treasuries: Home on the Range


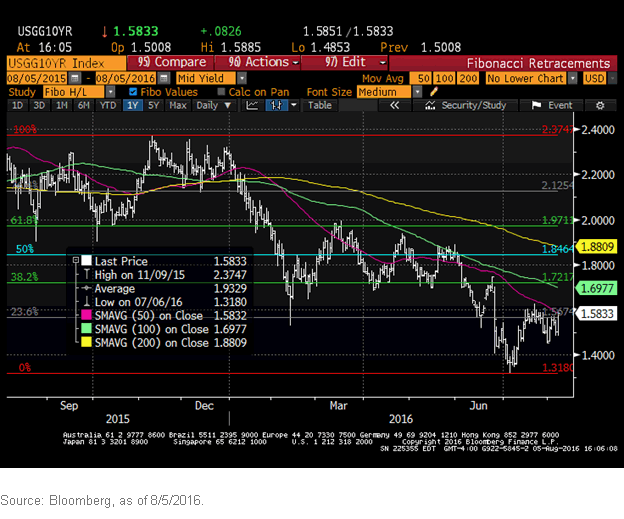
 In a surprising twist, the UST 10-Year yield hit its all-time closing low of 1.36% following the release of the June employment data in early July. Typically, jobs data that beat consensus forecasts (as was the case last month too) do not elicit a bond market rally. Interestingly, since then, the 10-Year yield has been consistently moving higher. In fact, the most recent UST 10-Year note auction may have offered a glimpse of investors’ lack of appetite, at least for now, as demand was measured at its lowest level since March 2009. From a technical perspective, the 10-Year yield has breached the Fibonacci line of 1.5674% a few times (a 23.6% retracement from the all-time low of 1.3180% that was reached on July 6, 2016) but remains measurably below the next level of 1.7217%, which would represent a 38.2% retracement from the aforementioned low. For the record, a 50% retracement would occur at the 1.8464% level.
Conclusion
So, where does that leave the UST 10-Year? Certainly, the 1.65%−2.45% trading range that had been in effect from roughly fall 2014 through early June of this year has now been replaced and pushed to the downside. From a near-term perspective, technical analysis would seem to point toward a new operating band of 1.30% to 1.75%/1.85%. Given the uncharted waters thesis, a negative geopolitical event or economic surprise (such as a U.S. recession) could create a new all-time low in yield, while on the other side of the ledger, a breach of the 50% retracement level would put 1.9711% in play.
Important Risks Related to this Article
Fixed income investments are subject to interest rate risk; their value will normally decline as interest rates rise. In addition, when interest rates fall, income may decline. Fixed income investments are also subject to credit risk, the risk that the issuer of a bond will fail to pay interest and principal in a timely manner or that negative perceptions of the issuer’s ability to make such payments will cause the price of that bond to decline.


