At the end of February, WisdomTree launched a suite of
fundamentally weighted fixed income Indexes. Over the course of our research on the
high-yield (HY) bond market, we found that
free cash flow (FCF) was among the most significant predictors of future
credit ratings downgrades or companies falling into financial distress. As a result, our Indexes include only bonds from companies with positive FCF over the previous five years (on average). During the course of our conversations about the strategies, one of the most frequent questions we’ve received is how our methodology has reacted to the swoon in energy credit fundamentals.
As of April 29, 2016, the
WisdomTree Fundamental U.S. High Yield Corporate Bond Index had a 2% weight to high-yield energy credit. This represents the most significant under-weight (11%) compared to a
market cap-weighted benchmark.
1
Below, we examine the trends in issuer fundamentals in the Energy sector against
credit spreads2 and movements in the price of oil. In our view, blindly allocating to many of these credits via a market capitalization-based approach could lead to dramatic underperformance, should oil prices fail to stabilize above $50–$55.
Even at Higher Oil Prices, Energy Fundamentals Were Declining
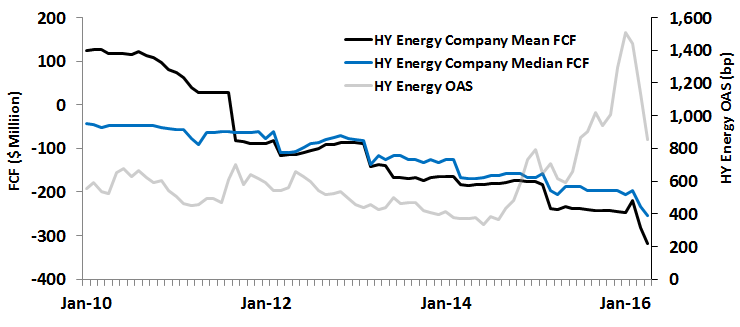
In the top panel below, we highlight the trend in FCF for the sector average and median on the left axis. This shows that even during periods of higher energy prices, there was a downward trend in FCF. While the operating cash flow side of the equation was reasonable, many energy firms were continuing to increase borrowing to reinvest in their businesses via new
capital expenditure. Additionally, credit markets through early 2014 were comfortable lending to borrowers at around +400
basis points (bps) over
U.S. Treasuries (right axis). However, this dynamic began to change in 2014 when we saw borrowing costs double over the course of a few months (from 400 bps to 800 bps).
3 Shortly after, we also saw a meaningful acceleration in the deterioration of HY energy fundamentals. With oil prices continuing to decline, credit spreads continued to widen, peaking at over 1600 bps in February 2016.
Energy Sector Fundamentals, 12/31/09–4/29/16
HY Energy Fundamentals vs. Credit Spreads
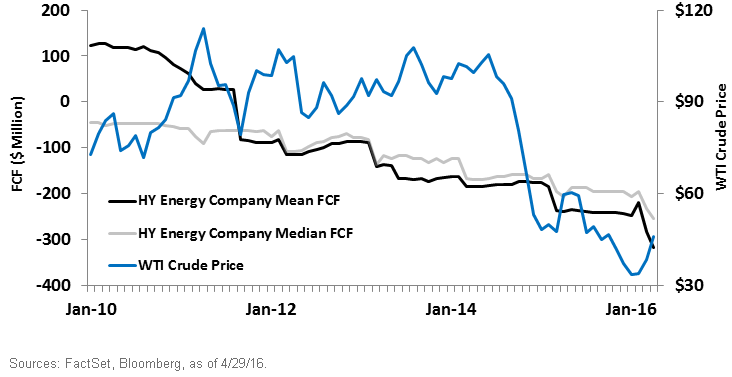
 HY Energy Fundamentals vs. Crude Oil

In the bottom panel, we also show the relationship between energy FCF and oil prices. While there does appear to be a modest
correlation, the price of oil impacts the various subsectors of the energy market differently. Companies associated with oil exploration are impacted much more significantly than businesses further downstream. However, the dramatic decline in the price of oil in early 2014 had a massive impact on borrowing costs for high-yield energy companies. While technical definitions for financial distress may vary, many market participants acknowledge that credit spreads in excess of 1000 bps generally imply distress. The recent recovery in oil from $30 to $48 has generated a massive reversal in high-yield energy credits, pushing spreads below distressed levels. Given the lag between fundamentals and changes in the price of oil, the magnitude of the rally could overstate the underlying improvement in energy credit. With the solvency of some businesses dependent on further extension of the rally in energy commodities, we don’t feel comfortable making such a binary bet. Instead, if one wants to bet on an oil rally, betting on oil directly is a far simpler approach.
While the trend in energy prices will continue to have a significant impact on high-yield energy credit total returns, we continue to believe that the trend in fundamentals can have a meaningful impact on potentially reducing risk and boosting total returns. While a quality approach may not outperform all the time, we believe the current market environment in energy credit continues to warrant caution. As a result, we do not believe market cap-based strategies with significant exposures to high-yield energy provide enough compensation, given the risks currently facing the market.
1As represented by the
The BofA Merrill Lynch US High Yield Index.
2As measured by
Option-adjusted spread (OAS).
3As represented by the
Barclays U.S. High Yield Energy Index.


 HY Energy Fundamentals vs. Crude Oil
 In the bottom panel, we also show the relationship between energy FCF and oil prices. While there does appear to be a modest correlation, the price of oil impacts the various subsectors of the energy market differently. Companies associated with oil exploration are impacted much more significantly than businesses further downstream. However, the dramatic decline in the price of oil in early 2014 had a massive impact on borrowing costs for high-yield energy companies. While technical definitions for financial distress may vary, many market participants acknowledge that credit spreads in excess of 1000 bps generally imply distress. The recent recovery in oil from $30 to $48 has generated a massive reversal in high-yield energy credits, pushing spreads below distressed levels. Given the lag between fundamentals and changes in the price of oil, the magnitude of the rally could overstate the underlying improvement in energy credit. With the solvency of some businesses dependent on further extension of the rally in energy commodities, we don’t feel comfortable making such a binary bet. Instead, if one wants to bet on an oil rally, betting on oil directly is a far simpler approach.
While the trend in energy prices will continue to have a significant impact on high-yield energy credit total returns, we continue to believe that the trend in fundamentals can have a meaningful impact on potentially reducing risk and boosting total returns. While a quality approach may not outperform all the time, we believe the current market environment in energy credit continues to warrant caution. As a result, we do not believe market cap-based strategies with significant exposures to high-yield energy provide enough compensation, given the risks currently facing the market.
1As represented by the The BofA Merrill Lynch US High Yield Index.
2As measured by Option-adjusted spread (OAS).
3As represented by the Barclays U.S. High Yield Energy Index.

