Why Japanese Dividends Should Entice Investors


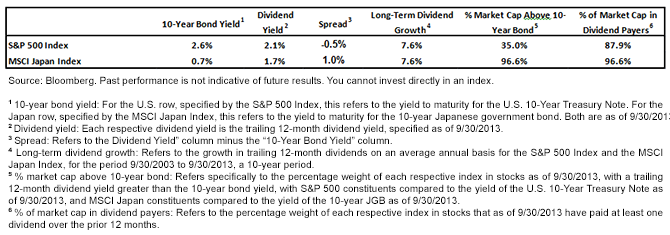
 To summarize: those looking at the trailing 12-month dividend yield of the MSCI Japan Index will realize that it is approximately 1.0% higher than that of the 10-year JGB yield. Traditional avenues of fixed income investment in Japan, compared to equities, offer significantly less yield with no potential growth of income. Moreover, if Japan’s central bank is successful at its stated goal of generating 2% inflation, that 0.7% offered in yield would suffer an after-inflation decline or loss in purchasing power1.
By contrast, with Japanese equities one has the potential to see dividends grow over time. Over the last 10 years, dividend growth in Japan has averaged about 7.6% per year2. Dividend-paying stocks could thus be an attractive income source that offers a potential inflation hedge.
Plotting the Historical Spread
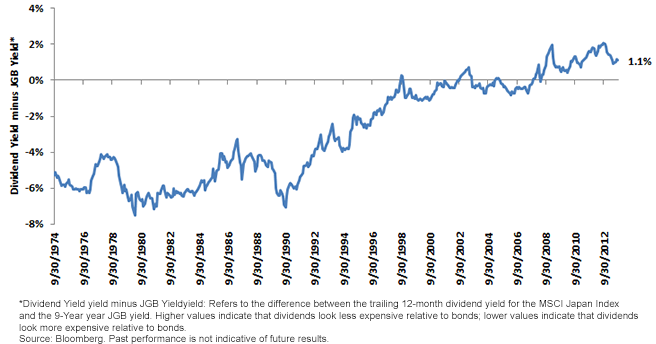
Going back to 1974, the period for which we have available data on JGB yields3, we can see that during most of that time, at least historically speaking, was characterized by JGB yields being higher than Japanese equity dividend yields . Only recently have yields on Japanese equities exceeded those on JGBs on a sustained basis.
Yield Spread (Dividend Yield Minus JGB Yield) for Japanese Equities vs. JGBs (9/30/1974–9/30/2013)
 • Japanese Equity Bubble: One of the lowest points on this chart (indicating much higher bond yields than dividend yields) occurred in 1989. This was around the bursting of the Japanese equity bubble, a time when Japanese equities were at some of their most expensive valuations in history—with dividend yields below 0.45% and the JGB yield at 5.6%.4
• 2008–09 Global Financial Crisis: One of the highest points on this chart (indicating equity dividend yields being higher than JGB yields) occurred in early 2009, the beginning of the 2008–09 global financial crisis. At this point in time, global equity markets saw prices collapse, dividend yields spike and bond yields fall. The dividend yield reached 3.13% while the JGB yield was 1.17%—at more than 1.90%, this was the highest spread of equities over JGBs.5
• Rare Events: It has been rare over the last 40 years for dividend yields on Japanese equities to be higher than JGB yields—in fact, it has occurred less than 20% of the time. Most of these periods have been in the last five years. And it is even rarer for the dividend yield spread to exceed 1%, with only 8.5% of the time periods we looked at showing that great of a spread.
A major takeaway from this analysis is that the dividend yield offered by Japanese equities is starting to look much more attractive as an income source compared to the traditional fixed income investments in Japan.
As a point of reference, prior to the financial crisis, the last time that the S&P 500 Index in the U.S. had a dividend yield greater than that of the U.S. 10-Year Treasury Note occurred prior to 1960.6
If the Japanese get some measure of confidence that the 25-year bear market that started on the heels of the peak bubble days of 1989 is coming to an end—and that inflation will become more the norm than deflation—the dividend yield spread offered by Japanese equities may be one of the most enticing elements getting Japanese investors to participate in their equity markets.
As we have written before, the Japanese are among the least allocated to their equity markets of any region in the world7—and we cannot blame them, given the declines they have suffered for so long. Times look like they are changing, and the dividend yield spread of equities over fixed income may be what will compel more serious asset allocation shifts.
1“Loss in purchasing power” references the fact that the bond coupon payments keep paying the same amount, but in an environment of rising prices that set amount will ultimately purchase less.
2“Dividend growth in Japan” refers specifically to the trailing 12-month dividend growth of the MSCI Japan Index from 9/30/2003 to 9/30/2013.
3JGB yields: For this analysis, we had to shift our focus to Japan’s 9-year government bond. Yield data going back to 1974 was not available for the 10-year JGB. We believe that the ultimate conclusion of our historical study will not be materially impacted by this adjustment, because based on the behavior of the JGB market, 9-year and 10-year JGB yields have tended to be quite similar.
4The specific date for this observation was 12/31/1989.
5The specific date for this observation was 2/28/2009.
6Source: Robert Shiller, Yale University, as of 9/30/2013.
7Sources: WisdomTree, Bloomberg, Bank of Japan, as of 12/31/2012.
• Japanese Equity Bubble: One of the lowest points on this chart (indicating much higher bond yields than dividend yields) occurred in 1989. This was around the bursting of the Japanese equity bubble, a time when Japanese equities were at some of their most expensive valuations in history—with dividend yields below 0.45% and the JGB yield at 5.6%.4
• 2008–09 Global Financial Crisis: One of the highest points on this chart (indicating equity dividend yields being higher than JGB yields) occurred in early 2009, the beginning of the 2008–09 global financial crisis. At this point in time, global equity markets saw prices collapse, dividend yields spike and bond yields fall. The dividend yield reached 3.13% while the JGB yield was 1.17%—at more than 1.90%, this was the highest spread of equities over JGBs.5
• Rare Events: It has been rare over the last 40 years for dividend yields on Japanese equities to be higher than JGB yields—in fact, it has occurred less than 20% of the time. Most of these periods have been in the last five years. And it is even rarer for the dividend yield spread to exceed 1%, with only 8.5% of the time periods we looked at showing that great of a spread.
A major takeaway from this analysis is that the dividend yield offered by Japanese equities is starting to look much more attractive as an income source compared to the traditional fixed income investments in Japan.
As a point of reference, prior to the financial crisis, the last time that the S&P 500 Index in the U.S. had a dividend yield greater than that of the U.S. 10-Year Treasury Note occurred prior to 1960.6
If the Japanese get some measure of confidence that the 25-year bear market that started on the heels of the peak bubble days of 1989 is coming to an end—and that inflation will become more the norm than deflation—the dividend yield spread offered by Japanese equities may be one of the most enticing elements getting Japanese investors to participate in their equity markets.
As we have written before, the Japanese are among the least allocated to their equity markets of any region in the world7—and we cannot blame them, given the declines they have suffered for so long. Times look like they are changing, and the dividend yield spread of equities over fixed income may be what will compel more serious asset allocation shifts.
1“Loss in purchasing power” references the fact that the bond coupon payments keep paying the same amount, but in an environment of rising prices that set amount will ultimately purchase less.
2“Dividend growth in Japan” refers specifically to the trailing 12-month dividend growth of the MSCI Japan Index from 9/30/2003 to 9/30/2013.
3JGB yields: For this analysis, we had to shift our focus to Japan’s 9-year government bond. Yield data going back to 1974 was not available for the 10-year JGB. We believe that the ultimate conclusion of our historical study will not be materially impacted by this adjustment, because based on the behavior of the JGB market, 9-year and 10-year JGB yields have tended to be quite similar.
4The specific date for this observation was 12/31/1989.
5The specific date for this observation was 2/28/2009.
6Source: Robert Shiller, Yale University, as of 9/30/2013.
7Sources: WisdomTree, Bloomberg, Bank of Japan, as of 12/31/2012.Important Risks Related to this Article
Foreign investing involves special risks, such as risk of loss from currency fluctuation or political or economic uncertainty Investments focusing on Japan increase the impact of events and developments in Japan, which can adversely affect performance. Dividends are not guaranteed and a company’s future abilities to pay dividends may be limited. A company currently paying dividends may cease paying dividends at any time.

Jeremy Schwartz has served as our Global Chief Investment Officer since November 2021 and leads WisdomTree’s investment strategy team in the construction of WisdomTree’s equity Indexes, quantitative active strategies and multi-asset Model Portfolios. Jeremy joined WisdomTree in May 2005 as a Senior Analyst, adding Deputy Director of Research to his responsibilities in February 2007. He served as Director of Research from October 2008 to October 2018 and as Global Head of Research from November 2018 to November 2021. Before joining WisdomTree, he was a head research assistant for Professor Jeremy Siegel and, in 2022, became his co-author on the sixth edition of the book Stocks for the Long Run. Jeremy is also co-author of the Financial Analysts Journal paper “What Happened to the Original Stocks in the S&P 500?” He received his B.S. in economics from The Wharton School of the University of Pennsylvania and hosts the Wharton Business Radio program Behind the Markets on SiriusXM 132. Jeremy is a member of the CFA Society of Philadelphia.

