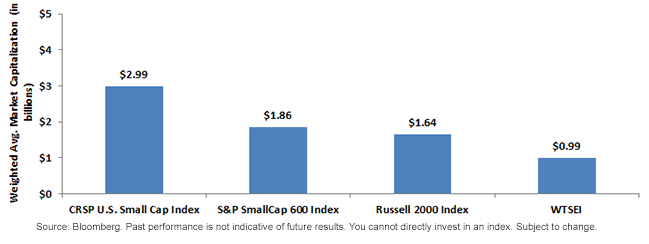
Some Small Caps Are Larger than Others


 A Look at Exposure to Firms with Less Than $2 Billion in Market Capitalization
Another way to judge the size exposure of an index is through a look at the percentage of its market capitalization in firms below a certain market capitalization level. In our analysis, we choose $2 billion; in other words, we’re determining that firms with a market capitalization below $2 billion are considered small-cap companies.1
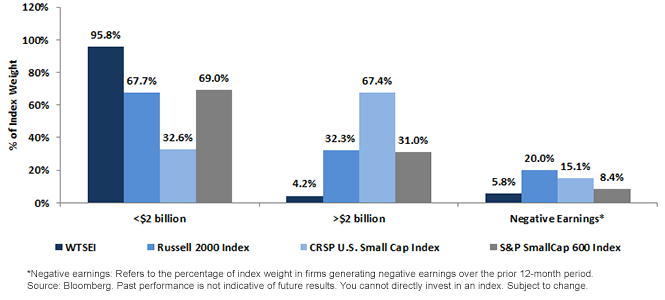
Percentage of Index Weight Above/Below $2 Billion and Percentage of Index Weight in Unprofitable Firms (as of 9/30/2013)
 • WTSEI with Nearly 96% of Weight in Stocks Below $2 Billion in Market Cap: At each year’s rebalance, WTSEI refocuses on the small-cap segment of the U.S. equity market. Other indexes (such as the S&P SmallCap 600) may include set numbers of companies or include mid-/large-cap firms that have fallen in price, or continue to hold small-cap firms that have appreciated in price.
• Majority of the CRSP U.S. Small Cap Index Are Above $2 Billion in Market Cap: It is interesting to us that almost 70% of the weight of the CRSP U.S. Small Cap Index is above $2 billion in market cap. It is notable that both the Russell 2000 and the S&P SmallCap 600 indexes are at about 30% by this metric. The three indexes beside WTSEI are weighted by market capitalization, so it is notable that the disparity is so large.
• Ongoing Profitability as an Inclusion Requirement: Each year, WTSEI’s rebalancing process includes a screen for those firms that have demonstrated profitability over the prior four quarters on a cumulative basis. The Russell 2000 Index has no such requirement. True, as the year progresses, firms may come in and out of profitability, but the fact that the Russell 2000 Index has approximately 20% of its market capitalization in firms that have not demonstrated profitability over the prior year is worth noting. To complete the picture, the S&P SmallCap 600 Index requires profitability for initial inclusion, whereas the CRSP U.S. Small Cap Index has no such requirement.
We’ve written multiple pieces discussing the fact that U.S. small-cap stocks have performed strongly for the first three quarters of 2013. We believe that this makes it ever more important to pay some attention to the relative valuations of these stocks. The fact of the matter is that while some sectors within U.S. small caps may have performed well, not every sector did so to the same degree. With WisdomTree, and especially with WTSEI, this creates the potential for more of an opportunity for the annual rebalance—which occurs every year in December—to add value. Specifically:
• Stocks whose earnings have increased but whose prices have remained constant or fallen may tend to see increased weights.
• Stocks whose earnings have fallen or remained constant but whose prices have risen may tend to see decreased weights.
Conclusion
In essence, a strategy of adherence to relative value rebalancing, we believe, has a greater potential to continue on a path of strong performance. No one ever knows what future performance will be, but refocusing on stocks whose fundamentals have done well but whose prices have yet to respond could be a positive.
1Ultimately, there is no one boundary universally used today in determining what separates a small-cap stock from a mid-cap stock—we used this as a useful illustration of what we believe is a common cutoff.
• WTSEI with Nearly 96% of Weight in Stocks Below $2 Billion in Market Cap: At each year’s rebalance, WTSEI refocuses on the small-cap segment of the U.S. equity market. Other indexes (such as the S&P SmallCap 600) may include set numbers of companies or include mid-/large-cap firms that have fallen in price, or continue to hold small-cap firms that have appreciated in price.
• Majority of the CRSP U.S. Small Cap Index Are Above $2 Billion in Market Cap: It is interesting to us that almost 70% of the weight of the CRSP U.S. Small Cap Index is above $2 billion in market cap. It is notable that both the Russell 2000 and the S&P SmallCap 600 indexes are at about 30% by this metric. The three indexes beside WTSEI are weighted by market capitalization, so it is notable that the disparity is so large.
• Ongoing Profitability as an Inclusion Requirement: Each year, WTSEI’s rebalancing process includes a screen for those firms that have demonstrated profitability over the prior four quarters on a cumulative basis. The Russell 2000 Index has no such requirement. True, as the year progresses, firms may come in and out of profitability, but the fact that the Russell 2000 Index has approximately 20% of its market capitalization in firms that have not demonstrated profitability over the prior year is worth noting. To complete the picture, the S&P SmallCap 600 Index requires profitability for initial inclusion, whereas the CRSP U.S. Small Cap Index has no such requirement.
We’ve written multiple pieces discussing the fact that U.S. small-cap stocks have performed strongly for the first three quarters of 2013. We believe that this makes it ever more important to pay some attention to the relative valuations of these stocks. The fact of the matter is that while some sectors within U.S. small caps may have performed well, not every sector did so to the same degree. With WisdomTree, and especially with WTSEI, this creates the potential for more of an opportunity for the annual rebalance—which occurs every year in December—to add value. Specifically:
• Stocks whose earnings have increased but whose prices have remained constant or fallen may tend to see increased weights.
• Stocks whose earnings have fallen or remained constant but whose prices have risen may tend to see decreased weights.
Conclusion
In essence, a strategy of adherence to relative value rebalancing, we believe, has a greater potential to continue on a path of strong performance. No one ever knows what future performance will be, but refocusing on stocks whose fundamentals have done well but whose prices have yet to respond could be a positive.
1Ultimately, there is no one boundary universally used today in determining what separates a small-cap stock from a mid-cap stock—we used this as a useful illustration of what we believe is a common cutoff.Important Risks Related to this Article
ALPS Distributors, Inc. is not affiliated with Vanguard. Investments focusing on certain sectors and/or smaller companies increase their vulnerability to any single economic or regulatory development.

Christopher Gannatti began at WisdomTree as a Research Analyst in December 2010, working directly with Jeremy Schwartz, CFA®, Director of Research. In January of 2014, he was promoted to Associate Director of Research where he was responsible to lead different groups of analysts and strategists within the broader Research team at WisdomTree. In February of 2018, Christopher was promoted to Head of Research, Europe, where he was based out of WisdomTree’s London office and was responsible for the full WisdomTree research effort within the European market, as well as supporting the UCITs platform globally. In November 2021, Christopher was promoted to Global Head of Research, now responsible for numerous communications on investment strategy globally, particularly in the thematic equity space. Christopher came to WisdomTree from Lord Abbett, where he worked for four and a half years as a Regional Consultant. He received his MBA in Quantitative Finance, Accounting, and Economics from NYU’s Stern School of Business in 2010, and he received his bachelor’s degree from Colgate University in Economics in 2006. Christopher is a holder of the Chartered Financial Analyst Designation.

