WTV
U.S. Value Fund

Published February 6, 2025

Director, Research
Why has the WisdomTree U.S. Value Fund (WTV) outperformed? The answer lies in its focus on shareholder yield.
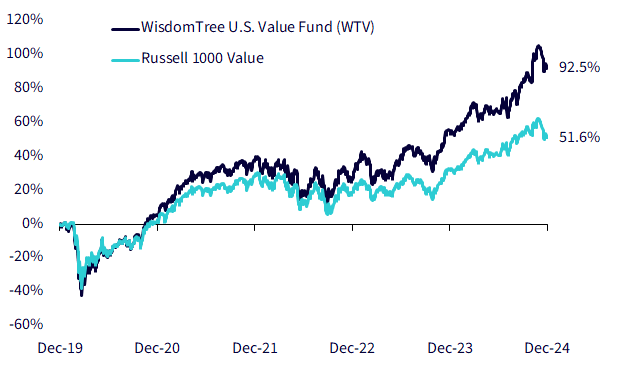
Sources: WisdomTree, FactSet, 12/31/19–12/31/24 at NAV. You cannot invest directly in an index. Past performance is not indicative of future results. Investment return and principal value of an investment will fluctuate so that an investor’s shares, when redeemed, may be worth more or less than their original cost. Current performance may be lower or higher than the performance data quoted. For the most recent month-end and standardized performances, click the ticker: WTV.
What is it? Shareholder yield measures how much cash a company returns to its shareholders through dividends and buybacks. It is calculated as:
Shareholder yield = (dividends per share + buybacks per share) / share price
Why does it matter? Companies that return cash to shareholders tend to be more efficient stewards of capital. Companies that consistently pay a dividend and buy back shares, particularly at lower relative valuations, may be less prone to wasting excess cash on low-return investments or expensive acquisitions.
To illustrate, consider General Motors (GM) and Tesla:
As of February 3, GM was a 1.02% weight in WTV, while Tesla was not included in the portfolio.
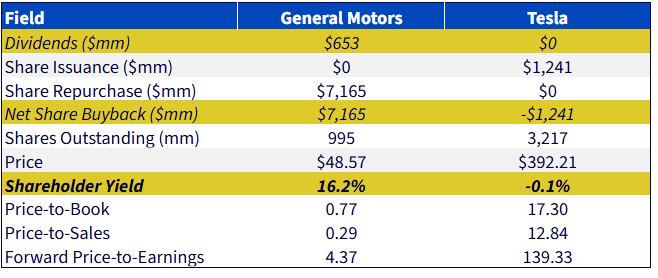
Sources: WisdomTree, FactSet, as of 1/25/2024.
For definitions of terms in the table, please visit our glossary.
Investors are familiar with dividend investing, and research consistently shows that companies with higher dividend yields tend to outperform over the long run.
Less attention is paid to share buybacks, which is another key lever for companies to return cash to shareholders.
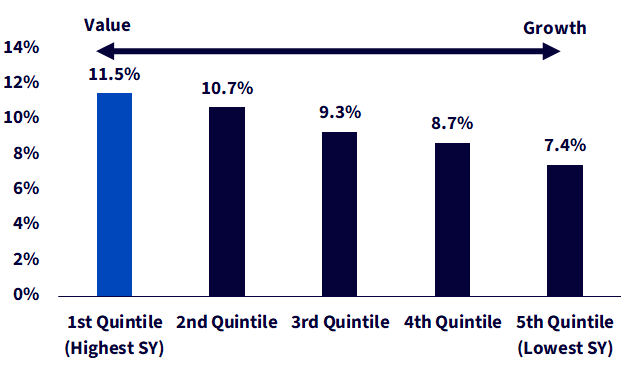
The bottom line from the Fama-French research below is straightforward:
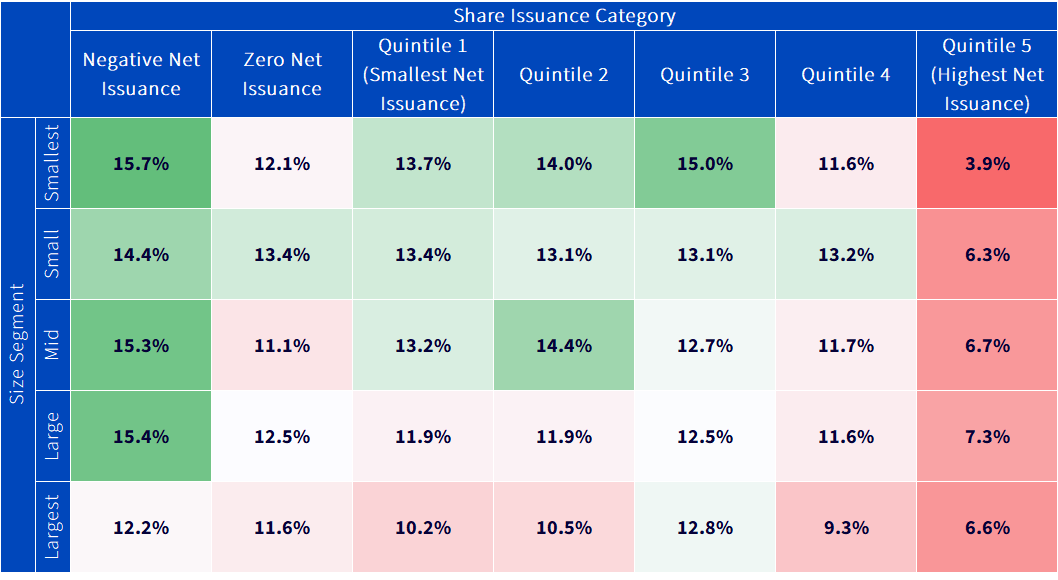
Sources: WisdomTree, Kenneth French Data Library. Returns from U.S.-listed companies from the Center for Research on Securities Prices (CRSP®) database. The portfolios, which are constructed at the end of each June, are the intersections of 5 portfolios formed on size (market equity, ME) and 5 portfolios formed on net share issues (NI). The size breakpoints for each year (year t) are the NYSE market equity quintiles at the end of June of year t. NI for June of year t is the change in the natural log of split-adjusted shares outstanding from the fiscal year end in t-2 to the fiscal year end in t-1. The NI breakpoints are NYSE quintiles.
Price-to-book (P/B) has long been a standard metric for evaluating value stocks and is the primary value metric used in the Russell 1000 Value Index.
Over the past five years, the MSCI USA Total Shareholder Yield Index has outperformed the Russell 1000 Value Index by 3.6% annually. During the same period, WTV outperformed the Russell 1000 Value Index by over 500 basis points annually.
This performance demonstrates the effectiveness of shareholder yield as a complementary—or improved—approach to traditional P/B value investing.
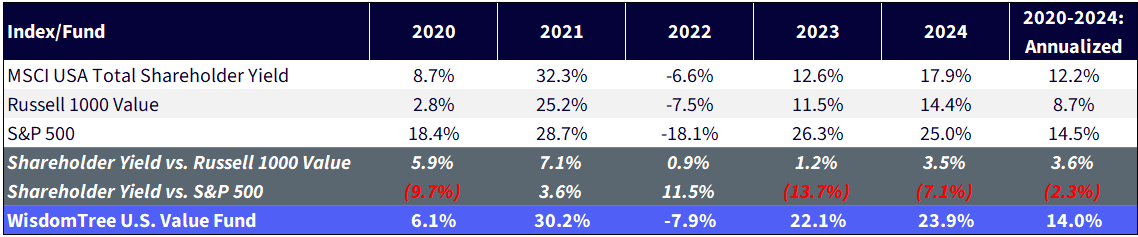
Sources: WisdomTree, Russell, MSCI, S&P, 12/31/19–12/31/2024 at NAV. You cannot invest directly in an index. Past performance is not indicative of future returns. Past performance is not indicative of future results. Investment return and principal value of an investment will fluctuate so that an investor’s shares, when redeemed, may be worth more or less than their original cost. Current performance may be lower or higher than the performance data quoted. For the most recent month-end and standardized performances, click the ticker: WTV.
Breaking down the Russell 1000 Index into quintiles based on shareholder yield and P/B reveals:
From 2018 to 2024, the top shareholder yield quintile outperformed the top P/B quintile by 400 basis points annually.
For investors wondering about WTV’s outperformance, the answer is straightforward: its systematic focus on shareholder yield has proven to be a powerful driver of returns.
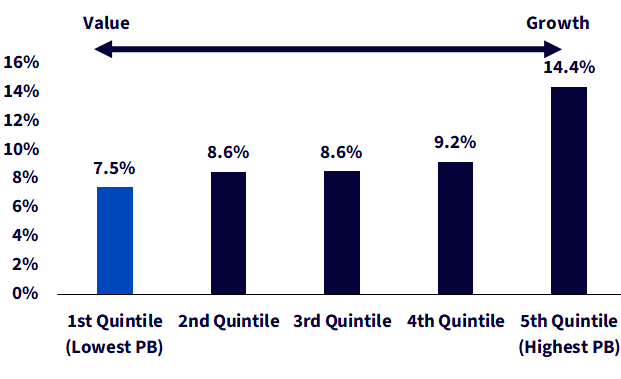
Sources: WisdomTree, Russell, 12/29/17–12/31/24. Quintile portfolios created using end of December data each year and constituents are equally weighted. Shareholder yield = 1st quintile (highest shareholder yield) within the Russell 1000 Index. Price-to-Book = 1st quintile (lowest P/B) within the Russell 1000 Index. You cannot invest directly in an index. Past performance is not indicative of future returns.
The shareholder yield focus for WTV is evident in a comparison to the Russell 1000 Value—its current shareholder yield advantage is over 300 basis points, with an average spread of 370 basis points.1
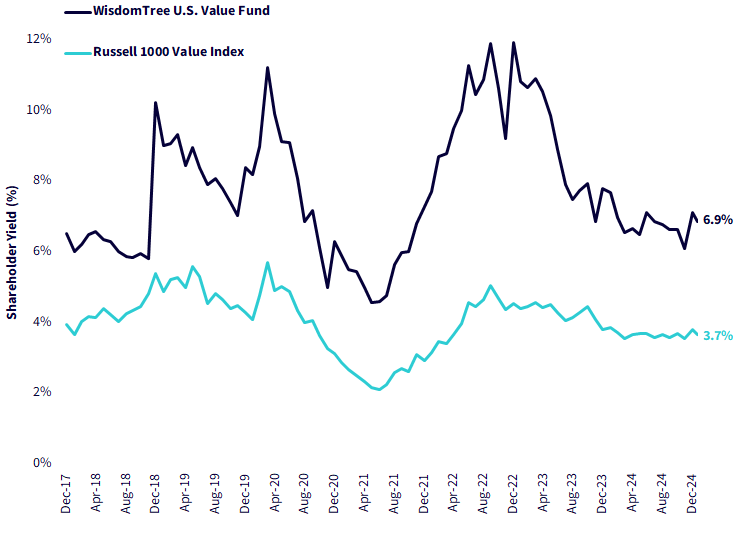
Sources: WisdomTree, Russell, FactSet, 12/29/17–1/21/25. Period chosen to coincide with the start of the shareholder yield-focused investment process of the WisdomTree U.S. Value Fund in December 2017. You cannot invest directly in an index. Past performance is not indicative of future results. Investment return and principal value of an investment will fluctuate so that an investor’s shares, when redeemed, may be worth more or less than their original cost. Current performance may be lower or higher than the performance data quoted. For the most recent month-end and standardized performances, click the ticker: WTV.
Without screening explicitly on price-to-earnings, the Fund has a significant discount to the Russell 1000 Value Index on that metric, as well.
A byproduct of finding value companies that are returning cash to shareholders is that these companies tend to be more profitable than other value approaches, as seen by the higher return on equity for WTV.
Sources: WisdomTree, FactSet, Russell, 1/21/25. You cannot invest directly in an index. Past performance is not indicative of future results. Investment return and principal value of an investment will fluctuate so that an investor’s shares, when redeemed, may be worth more or less than their original cost. Current performance may be lower or higher than the performance data quoted. For the most recent month-end and standardized performances, click the ticker: WTV.
For definitions of terms in the table, please visit our glossary.
In his book, Stocks for the Long Run, Emeritus Wharton Professor and WisdomTree Senior Economist Jeremy Siegel highlighted that the real (after inflation) return for the U.S. stock market going back to 1802 was just around 7%.
Many investors today are expecting returns significantly below that level, given elevated valuations.
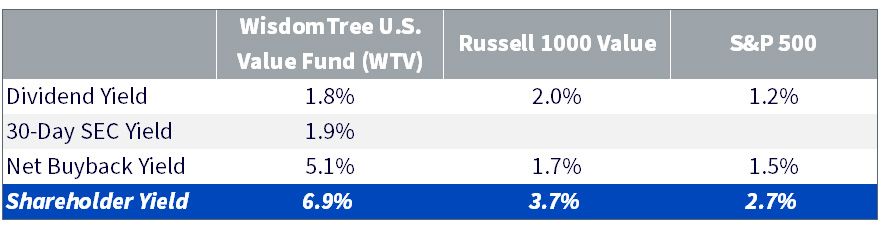
The companies in WTV are returning cash to shareholders at nearly 7%, potentially helping solve a challenge for investors of where to deploy capital in richly valued U.S. equities.
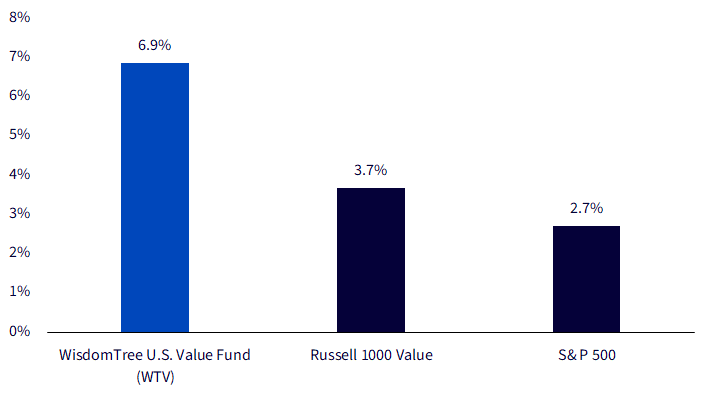
Sources: WisdomTree, FactSet, Russell, S&P, 1/21/25. You cannot invest directly in an index. Past performance is not indicative of future results. Investment return and principal value of an investment will fluctuate so that an investor’s shares, when redeemed, may be worth more or less than their original cost. Current performance may be lower or higher than the performance data quoted. For the most recent month-end and standardized performances, click the ticker: WTV.
1As of 1/21/25.
Funds focusing their investments on certain sectors increase their vulnerability to any single economic or regulatory development. This may result in greater share price volatility. While the Fund is actively managed, the Fund’s investment process is expected to be heavily dependent on quantitative models and the models may not perform as intended. You cannot invest directly in an index.
U.S. Value Fund

Director, Research
Matt Wagner joined WisdomTree in May 2017 as an Analyst on the Research team. He currently serves as a Director, where he supports the creation, maintenance, and reconstitution of WisdomTree’s indexes and actively managed ETFs. Matt began his career at Morgan Stanley, working as an analyst in Treasury Capital Markets from 2015 to 2017, focusing on unsecured funding planning, execution, and risk management. He graduated magna cum laude from Boston College in 2015 with a B.A. in International Studies, concentrating in Economics. In 2020, he earned a Certificate in Advanced Valuation from NYU Stern. He is also a Chartered Financial Analyst (CFA) charterholder.