GDE
Efficient Gold Plus Equity Strategy Fund

Published September 11, 2024

Global Head of Research
In August 2024, the price of gold eclipsed $2,500, a new record high.1 It’s amazing to consider this metal has been culturally significant in financial transactions for thousands of years.
In figure 1, we look back to 2000 and note the percentage change in gold prices. The year-to-date 2024 figure of 19%—which led to the record high—is not an extreme outlier. There are many different reasons that investors allocate to gold.2
It's difficult to know the “right” price level for gold at a given time, though it is interesting that in the 24 years from 2000 to 2023, five exhibited negative returns, and only two out of those exhibited negative returns in the double-digit percentages.
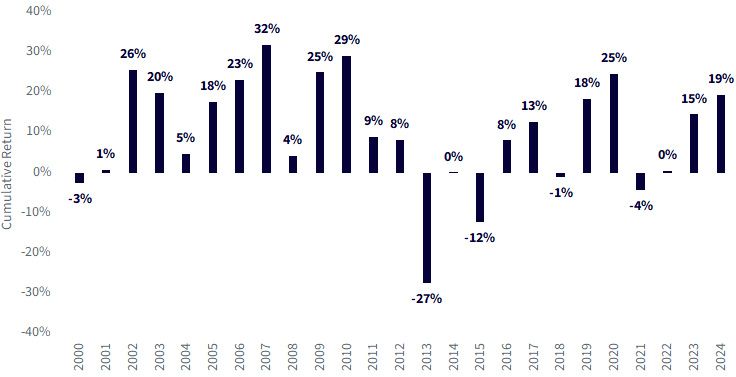
Source: Bloomberg. 2024 refers to the period 1/1/24–8/22/24. Past performance is not indicative of future results.
The typical way to build a portfolio is to think in terms of allocating 100% of a pie chart. A 60/40 portfolio tends to mean 60% in equities, 40% in fixed income. Some slice in a certain percentage to commodities or to gold.
There is no right or wrong allocation. But there are some ways to make portfolios go further than the typical limits of a 100% allocation.
WisdomTree developed a range of strategies based on the concept of stacking assets using prudent and capital-efficient leverage through futures.
Ultimately, there is no reason why, in one exchange-traded fund (ETF), one cannot allocate beyond 100%, thereby getting a greater notional exposure relative to every dollar invested.
Thinking of the WisdomTree Efficient Gold Plus Equity Strategy Fund (GDE) as an example:
If an investor placed $100 into GDE, their return experience would be based on $180 of notional exposure, with 50% driven by large-cap U.S. equities and 50% driven by gold futures.
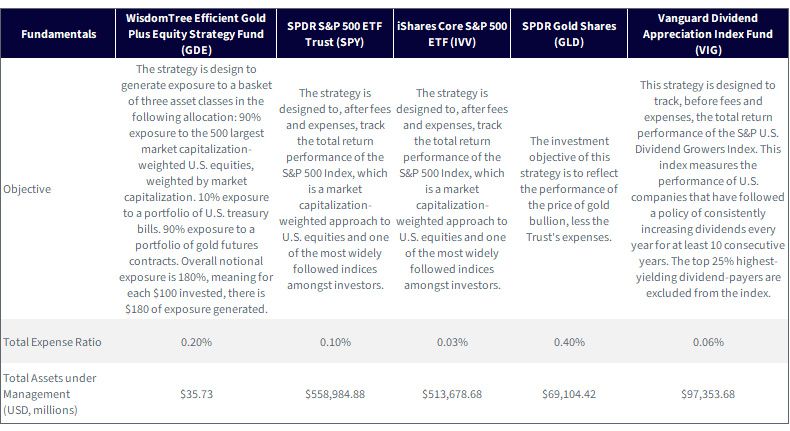
GDE is in the Morningstar U.S. Fund Large Blend category, so we started by posing the question—what are the three largest ETFs in this category by assets under management?
One might say—why include two funds that track the same underlying index? On August 22, 2024, there was nearly $560 billion in SPY and nearly $514 billion in IVV.3 When we talk about these two funds, we are talking about more than $1 trillion in investor assets, and it is almost evenly split between them. It’s clear that each is providing a use-case for investors.
We also wanted to recognize that the performance of gold is central to this discussion, in that we previously noted the key drivers of GDE's returns. The largest ETF option for investors seeking exposure to gold is the SPDR Gold Shares (GLD).
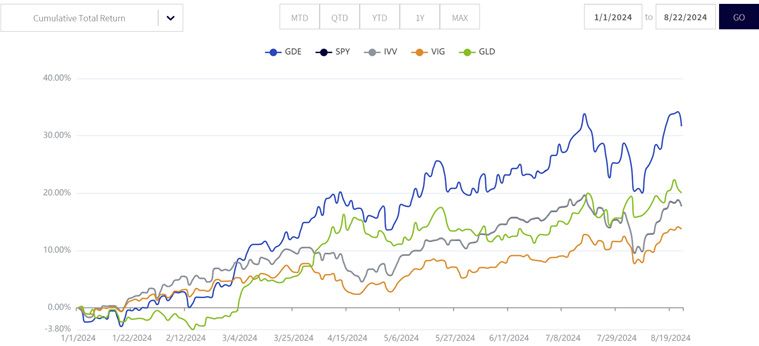
We wanted to explore how the performance of GDE compared to the performance of these four large and widely followed ETFs.
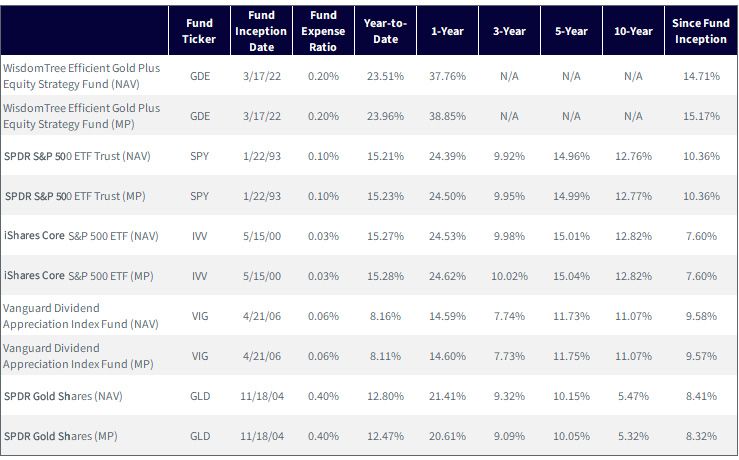
Source: WisdomTree, specifically data from the Fund Comparison Tool in the PATH suite of tools, 6/30/24. NAV denotes total return
performance at net asset value. MP denotes market price performance. Past performance is not indicative of future results.
Investment return and principal value of an investment will fluctuate so that an investor’s shares, when redeemed, may be
worth more or less than their original cost. Current performance may be lower or higher than the performance data quoted. For
the most recent month-end and standardized performance and to download the respective Fund prospectuses, click here.
When considering the returns of GDE, one must hold in mind:
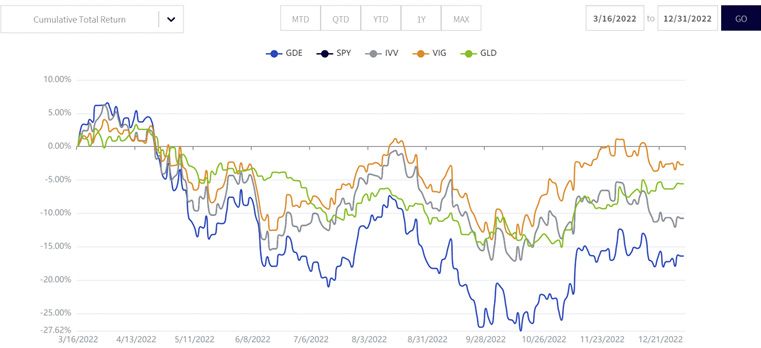
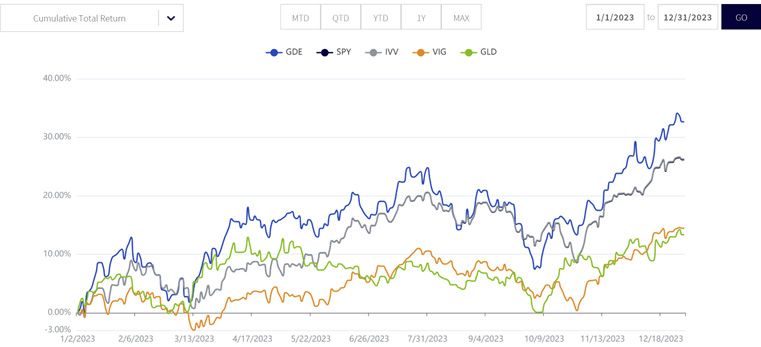
We look at GDE's returns against SPY, IVV, VIG and GLD over three distinct periods:
Generally speaking, if the price of gold is stable to rising and U.S. equities are doing well, this is a better environment for GDE. If the price of gold is volatile and falling and U.S. equities are trending more in the negative direction, this is a worse environment for GDE.
For the available history of 2022:
Source: WisdomTree, specifically data from the Fund Comparison Tool in the PATH suite of tools, as of 8/22/24. NAV denotes total return
performance at net asset value. MP denotes market price performance. Past performance is not indicative of future results. Investment
return and principal value of an investment will fluctuate so that an investor’s shares, when redeemed, may be worth more or less
than their original cost. Current performance may be lower or higher than the performance data quoted. For the most recent month-
end and standardized performance and to download the Fund prospectus, click here.
2023 saw:
Positive equity returns and gold price appreciation was a pretty good environment for GDE, overall.
Source: WisdomTree, specifically data from the Fund Comparison Tool in the PATH suite of tools, as of 8/22/24. NAV denotes total return
performance at net asset value. MP denotes market price performance. Past performance is not indicative of future results. Investment
return and principal value of an investment will fluctuate so that an investor’s shares, when redeemed, may be worth more or less
than their original cost. Current performance may be lower or higher than the performance data quoted. For the most recent month-
end and standardized performance and to download the Fund prospectus, click here.
In 2024 so far, we see:
Source: WisdomTree, specifically data from the Fund Comparison Tool in the PATH suite of tools, as of 8/22/24. NAV denotes total return
performance at net asset value. MP denotes market price performance. Past performance is not indicative of future results. Investment
return and principal value of an investment will fluctuate so that an investor’s shares, when redeemed, may be worth more or less
than their original cost. Current performance may be lower or higher than the performance data quoted. For the most recent month-
end and standardized performance and to download the Fund prospectus, click here.
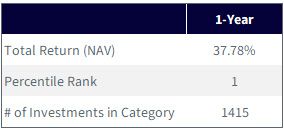
Now, even if IVV, SPY and VIG represent well over $1 trillion on their own, the Morningstar U.S. Fund Large Blend Category has a lot of other strategies within it. In figure 6, we see that GDE was in the first percentile, as of June 30, 2024, which means that over these periods it has generated better returns than 99% of the other funds in this category (over 1,400).
We know that the explanation for these results is the fact that the typical fund in this group would be exposed solely to U.S. equities and would not have a gold futures overlay. Still, Morningstar has placed GDE into this category, and we do believe that many investors allocate to U.S. equities and gold, but they typically do it separately. GDE offers a way to allocate to gold and U.S. equities in the same vehicle and free up capital to invest in other areas. Remember—for every $100 of nominal exposure, the notional investment is exposed to $180 ($90 in U.S. equities and $90 in gold futures).
Source: Morningstar, as of 6/30/24 (YTD performance through 6/30/24).
US Fund Large Blend. Morningstar, Inc. All rights reserved. The
information contained herein: (1) is proprietary to Morningstar and/or
its content providers; (2) may not be copied or distributed; and (3) is not
warranted to be accurate, complete or timely. Neither Morningstar nor
its content providers are responsible for any damages or losses arising
from any use of this information. Past performance, rankings and ratings
are no guarantee of future results. Regarding ranking of funds, 1 = Best.
Morningstar rankings are based on a fund's average annual total return
relative to all funds in the same Morningstar category. Fund performance
used within the rankings, reflects certain fee waivers, without which,
returns and Morningstar rankings would have been lower. The highest
(or most favorable) percentile rank is 1 and the lowest (or least favorable)
percentile rank is 100.
Sources: WisdomTree, Morningstar, as of 8/23/24.
1 Source: Leslie Hook & Harry Dempsey, “Gold Hits Record Highs as Investors Bet on Rate Cuts,” Financial Times, 8/21/24.
2 Source: McCauley et al, “The Russian Sanctions and Dollar Foreign Exchange Reserves,” VOXEU Column, 7/29/24.
3 Source: Morningstar.
4 Source: https://www.spglobal.com/spdji/en/indices/dividends-factors/sp-us-dividend-growers-index/#overview
5 Refers to the S&P 500 Index.
6 Refers to the Bloomberg U.S. Aggregate Index.
GDE: There are risks associated with investing, including the possible loss of principal. The Fund is actively managed and invests in U.S.-listed gold futures and U.S. equity securities. The Fund’s use of U.S.-listed gold futures contracts will give rise to leverage, magnifying gains and losses and causing the Fund to be more volatile than if it had not been leveraged. Moreover, the price movements in gold and gold futures contracts may fluctuate quickly and dramatically and have a historically low correlation with the returns of the stock and bond markets. U.S. equity securities, such as common stocks, are subject to market, economic and business risks that may cause their prices to fluctuate. The Fund’s investment strategy will also require it to redeem shares for cash or to otherwise include cash as part of its redemption proceeds, which may cause the Fund to recognize capital gains. Please read the Fund’s prospectus for specific details regarding the Fund’s risk profile.
SPY: In general, ETFs can be expected to move up or down in value with the value of the applicable index. Although ETF shares may be bought and sold on the exchange through any brokerage account, ETF shares are not individually redeemable from the Fund. Investors may acquire ETFs and tender them for redemption through the Fund in Creation Unit Aggregations only. Please see the prospectus for more details.
IVV: As with any investment, you could lose all or part of your investment in the Fund, and the Fund’s performance could trail that of other investments. The Fund is subject to certain risks, including the principal risks noted below, any of which may adversely affect the Fund’s net asset value per share (“NAV”), trading price, yield, total return and ability to meet its investment objective. Relative significance of any risk is difficult to predict and may change over time. You should review each risk factor carefully.
GLD: Although ETF shares may be bought and sold on the exchange through any brokerage account, ETF shares are not individually redeemable from the Fund. Certain investors may acquire ETFs and tender them for redemption through the Fund in Creation Unit Aggregations only. Please see the prospectus for more details. Investing involves risk, and you could lose money on an investment in GLD.
VIG: All investing is subject to risk, including the possible loss of the money you invest. Funds that concentrate on a relatively narrow market sector face the risk of higher share-price volatility. Investments in stocks or bonds issued by non-U.S. companies are subject to risks including country/regional risk and currency risk.
Efficient Gold Plus Equity Strategy Fund

Global Head of Research
Christopher Gannatti began at WisdomTree as a Research Analyst in December 2010, working directly with Jeremy Schwartz, CFA®, Director of Research. In January of 2014, he was promoted to Associate Director of Research where he was responsible to lead different groups of analysts and strategists within the broader Research team at WisdomTree. In February of 2018, Christopher was promoted to Head of Research, Europe, where he was based out of WisdomTree’s London office and was responsible for the full WisdomTree research effort within the European market, as well as supporting the UCITs platform globally. In November 2021, Christopher was promoted to Global Head of Research, now responsible for numerous communications on investment strategy globally, particularly in the thematic equity space. Christopher came to WisdomTree from Lord Abbett, where he worked for four and a half years as a Regional Consultant. He received his MBA in Quantitative Finance, Accounting, and Economics from NYU’s Stern School of Business in 2010, and he received his bachelor’s degree from Colgate University in Economics in 2006. Christopher is a holder of the Chartered Financial Analyst Designation.
