
60/40 Returns: Correlation Is Not Causation
Published December 12, 2023

U.S. Head of Research
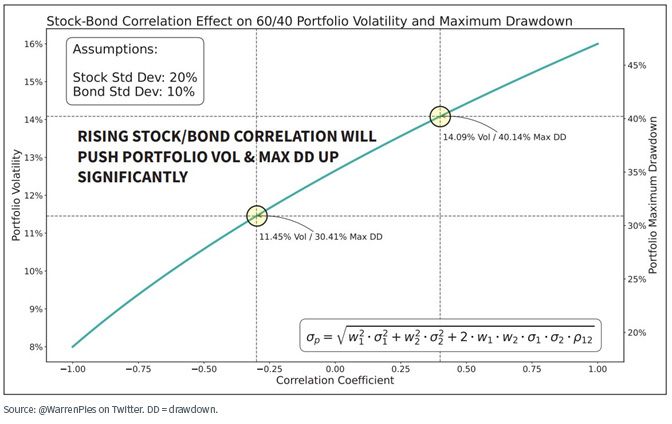
I love this chart. Taken straight out of Finance 101, it perfectly encapsulates the idea of portfolio diversification. With two different risky assets, an investor can minimize total portfolio volatility through the combination of investments with low to negative correlation. Over the last several months, investors have wondered if 60/40 portfolios (such as 60% S&P 500 Index, 40% Bloomberg U.S. Aggregate Index) should be abandoned because of the rise in correlation between stocks and bonds. Based on our research, it appears that it’s actually the starting yield in fixed income that impacts the correlation between stocks and bonds rather than a fundamental shift in market behavior. In a higher yield environment, 60/40 can deliver positive total returns despite correlation remaining positive.
“It ain’t what you don’t know that gets you into trouble. It’s what you know for sure that just ain’t so.”
– Mark Twain
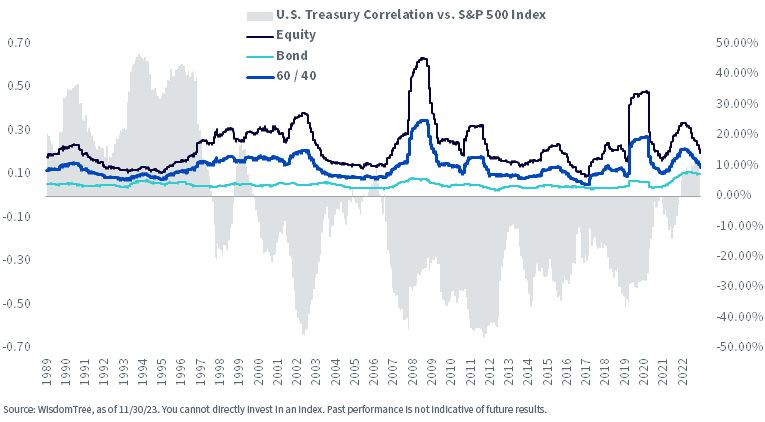
In the above framework, forecast portfolio volatility increases with higher correlations. However, looking at history, it’s a bit more nuanced than that. Below we show rolling one-year volatilities for equities (S&P 500 Index), bonds (Bloomberg U.S. Aggregate Index) and a 60%/40% balanced allocation.
A few observations.
First, total portfolio volatility is driven by equity risk. Equities tend to have higher volatility than bonds and they are also a larger weight in a 60/40 portfolio. Increases in volatility also are associated with equity drawdowns: markets seldom melt up.
In the early 1990s, 60/40 portfolio volatility remained unremarkable relative to history despite persistent positive correlation between stocks and bonds. What gives? In our view, positive correlation appears to be a function of bond yields. During periods with higher yields, fixed income more frequently delivers positive total returns. If rates rose, investors had a larger yield cushion to protect them from negative total returns. If equities also deliver positive returns over the period, correlation is positive.
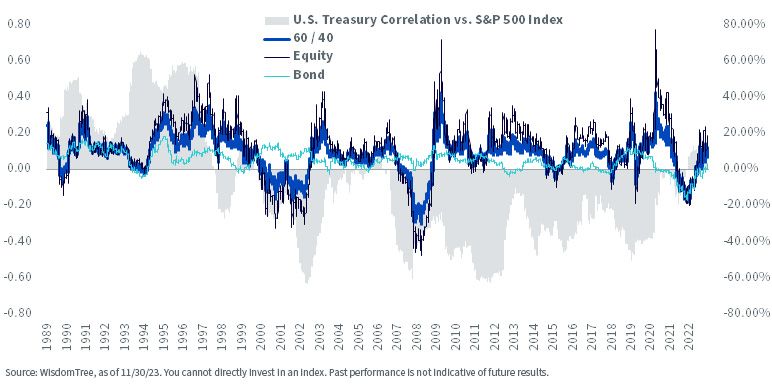
Rolling 1-Year Returns vs. Correlation of 10-Year U.S. Treasury & S&P 500 Index
Rolling 1-Year Volatility vs. Correlation of 10-Year U.S. Treasury & S&P 500 Index
Negative correlation between equities and bonds was most prevalent after large drawdowns. In these scenarios, equity performance that was persistently negative compared to fixed income returns that were generally positive meant that investors received heightened benefits from diversification. This had the impact of limiting drawdowns (as noted by the dispersion in returns between 60/40 portfolios and 100% equity portfolios). One of the anomalies of post-2008 investing has been the largely persistent negative correlation between stocks and bonds. This has primarily been a function of lower starting yields. This is also exemplified by the returns for fixed income more frequently turning negative during the period. In order for bonds to generate meaningful total returns during these periods, yields needed to fall.
With core fixed income correlations more closely resembling the relationship of cash and equities (i.e., very low levels of yield, effectively zero correlation), positive returns in fixed income were much more dependent on declining rates. With hindsight, we know that the market generated fairly consistent high levels of total returns whereas bonds were constrained by their starting yields.
What alarmed investors in 2022 was that correlations between stocks and bonds spiked dramatically and became positive during periods of negative market performance. During this period, correlations moved from negative to positive after the run up in equity prices from 2020. While returns for equities in 2021 were good, returns for both equities and bonds languished in 2022 as the Federal Reserve hiked rates aggressively.
Additionally, bond yields continued to rise in 2023 resulting in near-peak drawdowns for fixed income allocations. With narrow market leadership in U.S. equity markets, many investors are justifiably concerned.
While the traditional 60/40 allocation clearly faced a tough environment in 2022, the diversification power of bonds is returning.
Even if the Fed needs to increase interest rates further to tame inflation, the risk of negative total returns for fixed income has decreased markedly now that yields are at the highest levels in almost 20 years. If we contrast this to 2022, when bond yields were still near all-time lows, the pain has been more acute.
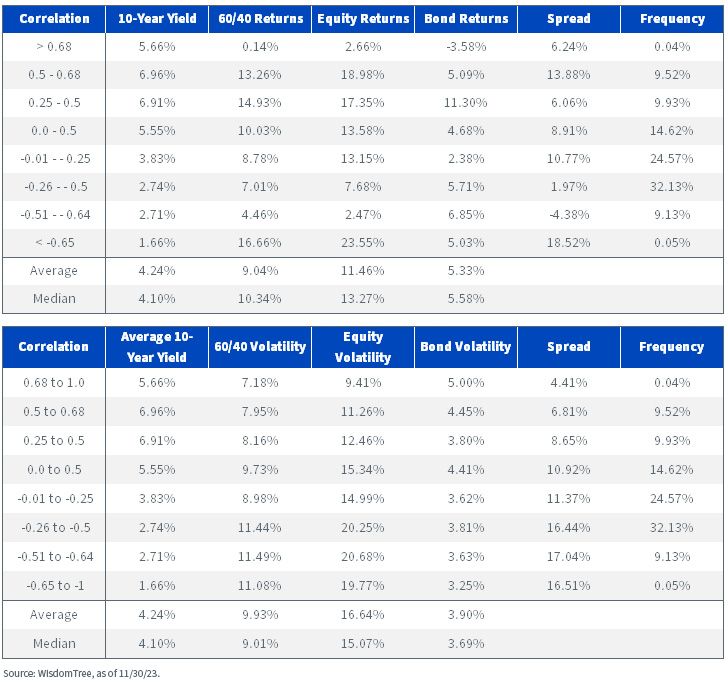
When we break the series down by correlation between stocks and bonds, some interesting things emerge.
First, it’s quite rare for stocks and bonds to have strongly positive or negative correlations over a given period. Over this time period, correlations peaked at 0.682 and -0.655, but occurred less than 0.1% of the time. Intuitively, the magnitude of returns is greatest on average when stocks and bonds are positively correlated. As we noted above, it’s much more likely for stocks and bonds to experience negative correlation when rates are lower. Stocks tend to perform best when the markets are positively correlated, but what’s also interesting is that the relative performance between stocks and bonds is most important when the markets are negatively correlated. During these periods, returns for fixed income are occurring due to falling rates as evidenced by comparing the 10-year yield of the periods to the returns for the Agg.
Going deeper, we evaluate market volatility through the lens of correlation in the second table. Correlation between stocks and bonds is generally positive in higher interest rate environments and negative correlation tends to coincide with low levels of yields.
Additionally, equity volatility (and by extension 60/40 volatility) tends to be higher during periods of negative correlation, which flies in the face of the textbook example of asset allocation. While bond volatility is higher during periods of high correlation, the magnitude is much lower than equities and generally more consistent. Finally, the spread between equity and bond volatility is generally around 10%. During periods with volatility in excess of 12%, equity markets may be unsettled, resulting in higher drawdowns.
Conclusion
Correlations matter, but these relationships frequently evolve over time, which makes the math of textbook asset allocation difficult. Additionally, investors must not lose sight of their expected returns for a given market. In the face of aggressive tightening from the Fed, many investors are worried about risk in the equity market.
In response, investors have historically increased their exposure to fixed income. As we have shown here, correlation is primarily driven by equity market risk, whereas positive bond/equity correlation has historically been driven by the starting level of yields. The big exception to this has been the most recent performance in the market when returns have been negative for equities as well as bonds, one of the most challenging periods for 60/40 returns.
Categories
About the contributor

U.S. Head of Research
Bradley Krom joined WisdomTree as a member of the research team in December 2010. He is involved in creating and communicating WisdomTree’s thoughts on global markets, as well as analyzing existing and new fund strategies. Prior to joining WisdomTree, Bradley served as a senior trader on a proprietary trading desk at TransMarket Group. Bradley is a graduate of the Wharton School, University of Pennsylvania.