

Time to glean profits from grains
Published 5 June 2018

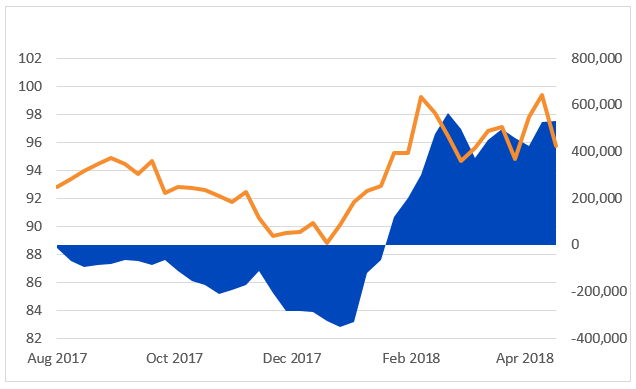
The 2018 price gains staged by wheat, corn and soybeans of 18%, 14% and 6% respectively (as of 18 May 2018), display a turnaround in the grains market that has, in the recent past, been plagued by weak prices due to rising inventories. In its first outlook for the 2018/19 (September/August) cycle, released on 10 May 2018, the US Department of Agriculture (USDA) was optimistic in its outlook for the grains market and this positive tone has recently been resonated in the futures market, with speculative positioning rising to its highest level since August 2017, according to commodity and futures trading commission data. Here’s a closer look at key agricultural commodity projections and the implications for investors.
Figure 1: Net positioning across grains turns positive
Source: USDA, Bloomberg, ETFSecurities. Past performance is not indicative of future results. You cannot invest directly in an Index.
Corn deficit
Based on USDA’s projections, the decline in world corn ending stocks puts the world stocks-to-usage ratio at 14.5%, compared to 21.8% last year. This would mark the second-tightest world stocks-to-usage ratio for corn since the 1973/74 season, rendering the new corn crop vulnerable to adverse weather conditions. Corn prices are trading at historically low levels relative to the stocks-to-usage ratio and given that corn prices are known to exhibit the most pronounced negative correlation (0.55) to the stocks-to-usage ratio among all grains, we expect to see a significant catch up in corn prices, similar to that witnessed in 2010. However, as corn enters the prime growing season of June to September, it remains exposed to significant price pressure.
Figure 2: Corn prices lag tightening stocks-to-usage ratio
Source: USDA, Bloomberg, ETFSecurities. Past performance is not indicative of future results. You cannot invest directly in an Index.
Soybean plantings to exceed corn plantings
Low agricultural commodity prices are resulting in a paradigm shift in the US towards increased production of soybeans in lieu of resource-intensive corn and wheat. USDA expects soybean plantings to exceed corn plantings in 2018 by the greatest level ever. Despite USDA projecting global soybean production to rise on the back of a recovery from the drought in Argentina, higher soybean crush and exports are expected to offset most of the rise, with global soybean ending stock estimates declining by 5.5 million tons.
After the announcement of punitive tariffs on US soybean imports by China, China’s 2018/19 soybean imports are projected to decline for the first time in 15 years. At the same time, China’s soybean acreage is set to be expanded by around 9%, according to sources from the Chinese Ministry of Agriculture. While this will contribute to production, China will only be producing approximately 12% of the amount of soybeans it consumes. Considering China’s rising soybean demand, we do not expect the current developments to interfere with the country’s import requirements and expect to see a resolution to the ongoing trade disputes.
Figure 3: Soybeans ending stocks
Source: USDA, Bloomberg, ETFSecurities. Past performance is not indicative of future results. You cannot invest directly in an Index.
Tough conditions for winter wheat
Wheat remained the weak link in USDA’s latest report. Since the start of 2018, a large part of wheat’s upward price momentum can be attributed to reports of tough conditions for winter wheat crop in Kansas, the most important US growing state, and other key regions. As it stands, 50% of Kansas winter wheat, 68% of Oklahoma winter wheat and 60% of Texas winter wheat is in poor or very poor condition. Planting progress shows winter wheat was 36% headed, falling behind the five-year average pace of 41%. However, USDA surprised investors by projecting a 5% increase in US wheat production due to a strong rise in spring wheat, despite poor winter wheat conditions.
Despite the 15% decline projected for Russian wheat crop, global wheat stocks are expected to be only 2% short of the 2017/18 all-time high. However, world ending stocks for 2018/19 are estimated to be lower at 955 million bushels, a positive development, which if realised would mark a four-year low.
How to gain exposure to agricultural commodities
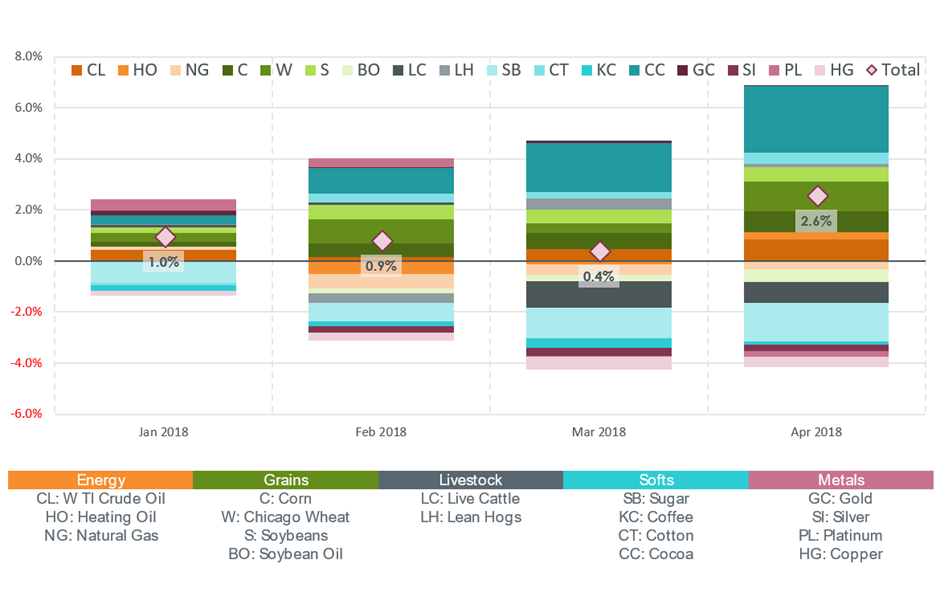
Due to the strong performance of the grains market in 2018, the Continuous Commodity Futures Price Index (CCI Index), which has a high allocation to grains and agricultural commodities (47%), has risen 3.27% (as of 18 May 2018).
Figure 4: Cumulative contribution to spot return - year to date
Source: USDA, Bloomberg, ETFSecurities. Past performance is not indicative of future results. You cannot invest directly in an Index.
Positive contributors to the spot return this year have been energy, grains and cocoa, as per the chart. For investors looking to gain exposure to grains and agricultural commodities, the CCI Index offers diversified exposure to commodities while maintaining a tilt to grain and agricultural commodities.
Related products
Categories
About the contributor

Director, Macroeconomic Research, WisdomTree Europe
@AneekaGuptaWTAneeka Gupta is Director of Research at WisdomTree. Prior to the acquisition of ETF Securities in April 2018, Aneeka worked as an Equity & Commodities Strategist at the company. Aneeka has 17 years of experience working as a Research Analyst across a wide range of asset classes. In her current role she is responsible for conducting analysis for all in-house equity, commodity and macro publications and assisting the sales team with client queries around products and markets. Prior to WisdomTree, Aneeka began her career as an equity analyst at Bear Stearns International Ltd in London. She also worked as an Equity Sales Trader at Sunrise Brokers across US and Pan European Exchanges. Before that she worked as an Equity Derivatives Sales Manager at Mashreq Bank in Dubai. Aneeka holds a Masters in Mathematics from Oxford University and a BSc in Mathematics from the University of Delhi, India. She is also a CFA Charterholder.