

Our alpha signals: what has “worked” thus far
Published 23 October 2018

Global Head of Research
The WisdomTree US Multifactor Index (WTUSMF), launched in June 2017, selects its 200-stock basket based on four equally-weighted alpha signals: low correlation, momentum, quality and value. While 14 months is an admittedly short time-frame to analyse returns of factors proven to outperform over years and decades, we will review which factors have “worked” thus far, and how the index is positioned from a factor and fundamental characteristic perspective after its most recent quarterly rebalance.
To start, the WTUSMF has performed very well since it launched—out-performing the S&P 500 by 327 basis points1. Let’s look at what factors performed well over that period.
Technical and fundamental factor returns
Using S&P 500 constituents we can analyse the performance across the four factors on WisdomTree’s methodology. The composite factor score for the purposes of stock selection within WTUSMF is an average of four factors, with value and quality being driven by fundamentals, while momentum and correlation are driven by technical factors or price. For further information on the factors included, please see our previous blog: WisdomTree launches a US multifactor strategy.
The range between “good” and “bad” categories is ranked by the relative performance of the constituents. This can be seen on figure 1. The good, okay, and bad categories, by design, each contain roughly a third of the total market-cap of the S&P 500. Comparing the good baskets, the best performing factor in terms of absolute return has been quality, returning 25.15%. The worst-performing factor has been low correlation, with the good basket underperforming the bad basket by over 17%.
Figure 1: S&P 500 factor returns
Source: WisdomTree, FactSet. Returns from 29 June 2017 to 31 August 2018. You cannot invest directly in an index. Returns are calculated on a gross basis with respect to US dividend tax withholdings. Within each of the four factors (Low Correlation, Momentum, Quality & Value), the “Good”, “Ok” and “Bad” categories comprise approximately one-third of the market capitalization of the S&P 500 Index, $8.5 trillion. Rankings are determined based on the factor methodologies within the WisdomTree US Multifactor Index, with the top one-third on the specific factor termed “good”, the middle one-third termed “okay”, and the bottom one-third “bad.” Precise numbers of stocks within the respective Good, Okay and Bad categories by factor are as follows: for Correlation: 265, 132, 104; for Momentum: 131, 129, 191; for Quality: 129, 184, 191; and for Value: 208, 139, 158.
We can make a few conclusions from these factor returns:
- Big companies historically outperforming: The run in the S&P 500 has been powered by a narrowing segment of the market – i.e. the biggest companies in the index. Because these biggest companies are more highly correlated with the returns of a market-cap weighted index, they tend to rank poorly on our low correlation factor and are in the bad category.
- Momentum and quality late-cycle: Momentum and quality typically outperform late cycle, and we are seeing that play out in real-time. The design of momentum for WTUSMF uniquely uses risk-adjusted returns rather than absolute returns to tap into the long-term absolute return potential of the factor but with an eye towards improving risk-adjusted returns.
- Quality and growth in-favour, value out: Seeing good value under-performing bad value (i.e. expensive ‘growth stocks’) also comes as no surprise as this has been a persistent trend for several years now and is typical in the middle-to-latter part of a bull market. While many investors seem to be bracing their portfolios for value mean-reversion, recent returns seem to indicate we are not quite there yet.
Low correlation: What it means for the tech giants
Two of the top contributors to returns of the S&P 500, particularly in 2018 have been Apple and Amazon. Since inception, WTUSMF has been underweight Apple by 3.36% and Amazon by 2.33%, causing these companies to be the two biggest detractors from relative performance to the S&P 5002. These under-weights, in some ways, make the historical out-performance of the WTUSMF over this timeframe even more impressive.
In the below table we show our factor scores, which rank companies between 0-100%, of Apple and Amazon at each of our five live quarterly rebalances. At our most recent September rebalance, Apple was included in WTUSMF for the third time, this time on the back of an improved Momentum score.
Both companies have tended to rank in the bottom third of our eligible 800 stock universe by Low Correlation, meaning that their scores on the other three factors need to make up for that score to be included. For example, at this September’s rebalance, Apple had scores in the top third on the other three factors despite just an 18% score on low correlation.
Figure 2: Factor ranking percentiles of Amazon & Apple over time
Source: WisdomTree, FactSet. Data from 29 June 2017 to 31 August 2018.
Balanced factor exposures
While we believe different factors perform well during different times of the cycle, it is difficult to know ex-ante what stage of the cycle we are in and equal weighting our four desired factors is a natural starting point.
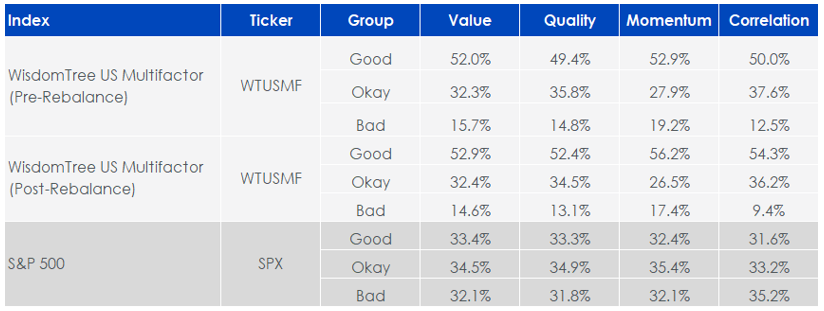
In the below table we show the index weights of WTUSMF and the S&P 500 (SPX) in the Good, Okay, and Bad groups as of the WTUSMF rebalance screening date. As mentioned above the S&P 500 has roughly one-third of its weight in each group. The WisdomTree Index has its weight evenly distributed across factors, with weights of roughly 52-56% in each good group, and just as importantly significant underweights in the bad groups. What this tells us is that the Index is tapping into the material factor tilts without giving too much influence to any single factor. While each factor tilt was improved by the rebalance, the biggest changes came from the two technical factors, momentum and correlation, which we often see given the fast-moving nature of these factor scores.
Factor quilt
Source: WisdomTree, FactSet. Data as of 31 August 2018, the Index screening date for the WisdomTree US Multifactor Index. You cannot invest directly in an index.
Historical performance is not an indication of future performance and any investments may go down in value.
Lower price/earnings and improved quality metrics
Another way our factor tilts manifest themselves is in the valuations of the WisdomTree US Multifactor Index relative to the S&P 500. The value tilt is evident in the price-to-earnings (P/E) discount and higher Quality from Return-On-Equity (ROE) and Return-On-Asset (ROA) improvements from the market. Another factor that we tap into via our alternative weighting mechanism is size, which can be seen by our material overweight to mid-caps.
Source: WisdomTree, FactSet. Data as of 31 August 2018, the Index screening date for the WisdomTree US Multifactor Index. You cannot invest directly in an index.
Historical performance is not an indication of future performance and any investments may go down in value.
Our quarterly rebalance plays a critical role in maintaining balanced factor exposures that may drive long-term outperformance. Over this timeframe, momentum and quality have been the best performing factors, with low correlation and value lagging. Given the cyclicality of factors and the challenges of factor timing, we believe our high factor tilt and higher active share approach is positioned to add relative value across market environments.
1 Returns are calculated on a gross basis with respect to US dividend tax withholdings.
2 WisdomTree, FactSet. Data from 29 June 2017 to 31 August 2018.
Related blogs
+ WisdomTree US Multifactor Index: Taking on the competition
+ US Equities throw down the challenge in 2H18: could multifactor be the answer?
Categories
About the contributor

Global Head of Research
Christopher Gannatti began at WisdomTree as a Research Analyst in December 2010, working directly with Jeremy Schwartz, CFA®, Director of Research. In January of 2014, he was promoted to Associate Director of Research where he was responsible to lead different groups of analysts and strategists within the broader Research team at WisdomTree. In February of 2018, Christopher was promoted to Head of Research, Europe, where he was based out of WisdomTree’s London office and was responsible for the full WisdomTree research effort within the European market, as well as supporting the UCITs platform globally. In November 2021, Christopher was promoted to Global Head of Research, now responsible for numerous communications on investment strategy globally, particularly in the thematic equity space. Christopher came to WisdomTree from Lord Abbett, where he worked for four and a half years as a Regional Consultant. He received his MBA in Quantitative Finance, Accounting, and Economics from NYU’s Stern School of Business in 2010, and he received his bachelor’s degree from Colgate University in Economics in 2006. Christopher is a holder of the Chartered Financial Analyst Designation.