DGRA LN
WisdomTree US Quality Dividend Growth UCITS ETF - USD Acc

Published 5 March 2024

Head of Research, WisdomTree Europe.
Since the first edition of the Stock Trader’s Almanac in 1967, the influence of the US presidential cycle on equity markets has been widely discussed. While current geopolitical and economic conditions impact markets more sharply, those political considerations can still inform investors’ decisions.
In Figure 1, we plot the average trajectory of US equity markets over each year of the four-year US presidential cycle. For that purpose, we use data from the Kenneth French data library, starting in June 1963, which includes all CRSP firms incorporated in the US and listed on the NYSE, AMEX, or NASDAQ. The data covers almost 15 presidential terms and ten different presidents (five from each party).
The strongest year, by quite a margin, tends to be the third year in a presidential term. On average, US equity markets gain 22%, while the average performance over a year (independently of the year in the presidential term) is 11.6%. The second year in the term is the weakest, with a performance average of 1.9%.
The first year of the term and the last year of the term, i.e. the presidential election year, show average performance. Both years return on average around 11%. Having said that, looking more closely at the trajectory of equities in this fourth year, we note that the first trimester tends to be quite weak, with almost no performance created. Then the second and third quarters are the strongest with around 4% of performance each and the last quarter is a bit weaker at 2.6%.
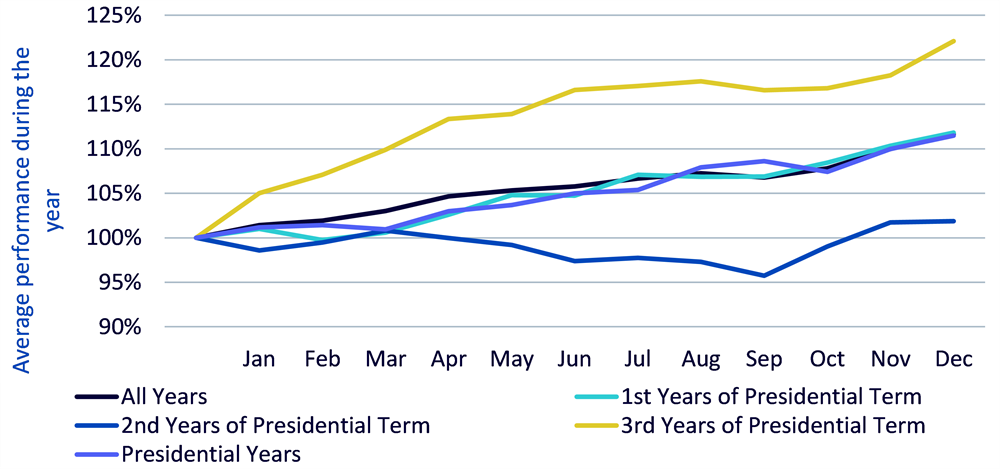
Source: WisdomTree, Kenneth French data library. Data is calculated at a monthly frequency and from June 1963 to Nov 2023. The portfolios are rebalanced yearly at the end of June. The market represents the portfolio of all available publicly listed stocks in the US. All returns are in USD. You cannot invest in an index. Historical performance is not an indication of future performance and any investments may go down in value.
Anecdotally, here is the performance of the S&P 500 during the Biden Term:
So, in line with the pattern, the third year proved to be the strongest of the term so far, and the second year was the weakest by far. The first year in Biden’s term was above average though.
Digging further into this presidential term data, we can try to compare the performance of different type of stocks. In Figure 2, we focus on four ways to split the US markets:
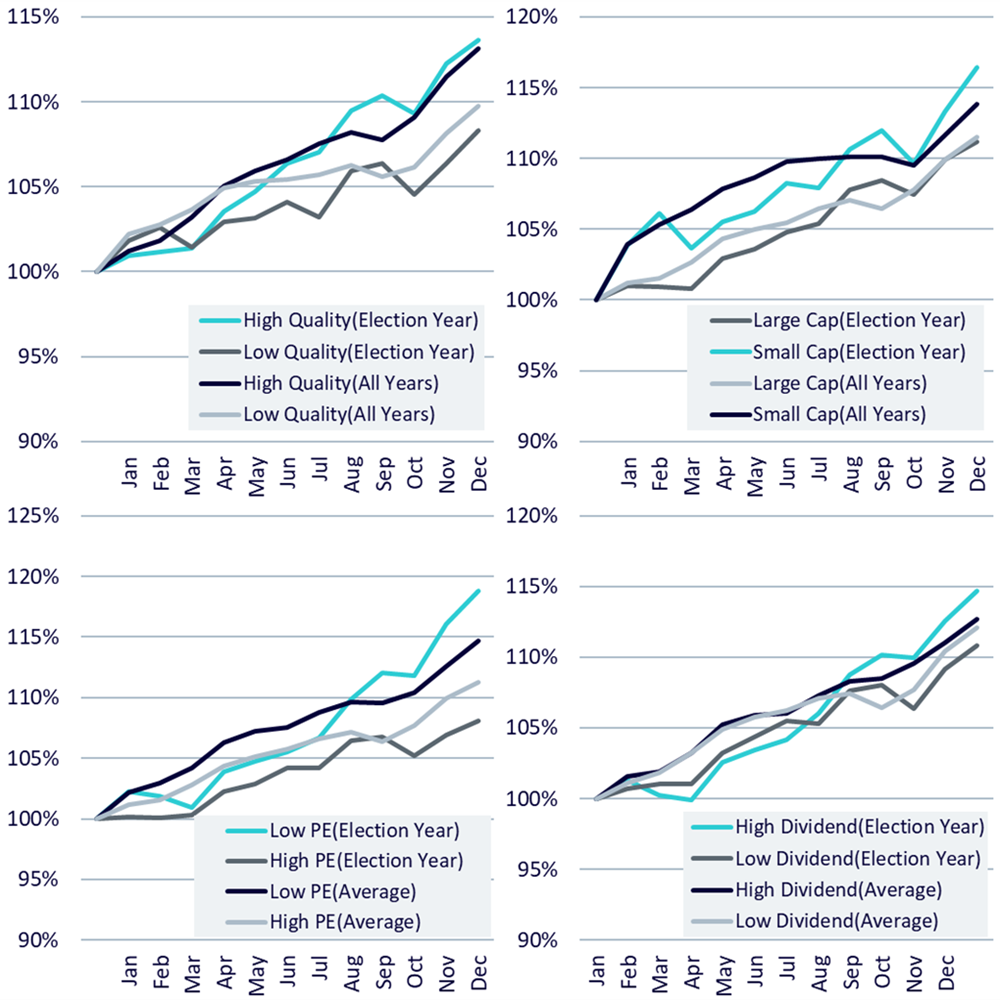
Source: WisdomTree, Kenneth French data library. Data is calculated at a monthly frequency and from June 1963 to Nov 2023. The portfolios are rebalanced yearly at the end of June. The market represents the portfolio of all available publicly listed stocks in the US. All returns are in USD. You cannot invest in an index. Historical performance is not an indication of future performance and any investments may go down in value.
Across all four analyses we note that the premium usually observed between both groups of stocks is exacerbated in election years:
Timing-wise, this exacerbation of factor performance is not homogeneous. High quality tend to outperform almost the full year on a regular basis with a slightly stronger 2nd and 3rd trimester. The other three create the extra outperformance mostly in the second half of the year, after being dominated in the first half.
2024 is not a year to sit on the sidelines. The presidential cycle suggests positive equity performance could be expected in the last nine months of the year. Factors like high quality, high dividend, value stocks and small caps could benefit in those periods. Interestingly enough, this positioning aligns well with our current market outlook, which favours high dividend and quality stocks to adapt to the current uncertainty in the market, wrought by the many elections around the world (half the world’s population is voting in 2024) and the unpredictability of Central Banks around monetary loosening. But also to benefit from expected rate cuts in the second half of the year, which could push markets higher.

Head of Research, WisdomTree Europe.
Pierre Debru leads WisdomTree’s European research team and plays a pivotal role in the strategic direction of our European research efforts. His key areas of expertise extend across equity factors and quantitative strategies, portfolio construction and model portfolios, and thematic and crypto investments. Before joining the company in 2019, Pierre worked in Investment Research for DWS and the Xtrackers range for over five years. During this period, he focused on smart beta investments, model portfolio construction and thought leadership. Pierre has over 20 years of experience in investments and structured asset management. He graduated from Ecole Central Paris and obtained a Master of Science in Mathematics applied to Finance.


